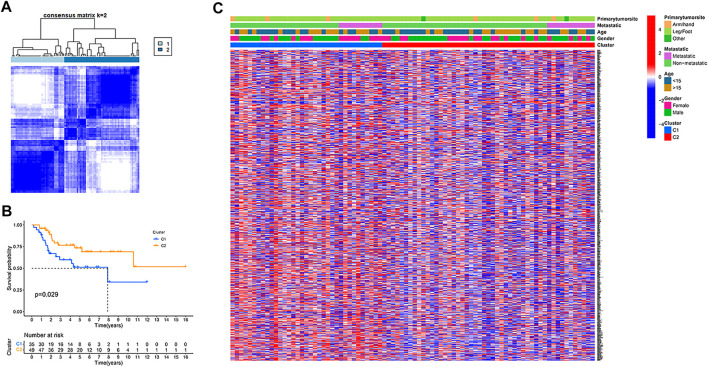
FIGURE 1.
Tumour classification based on the hypoxia-related genes. (A) 84 osteosarcoma patients were grouped into two clusters according to the consensus clustering matrix (k = 2). (B) Kaplan–Meier overall survival curves for the two clusters. (C) A heatmap (blue: low expression level; red: high expression level) for the connections between clinicopathologic features and the clusters.

