Figure 2.
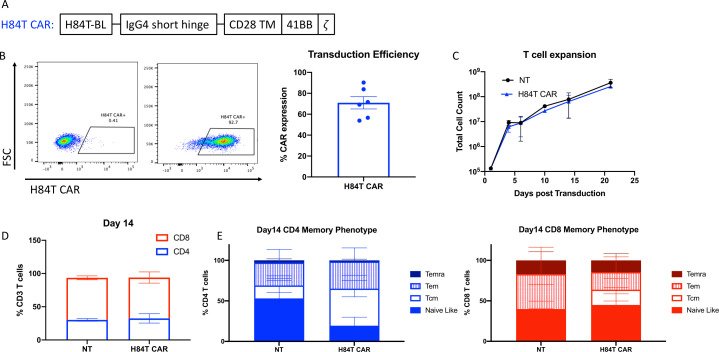
H84T CAR T-cell development. (A) Schematic diagram of retroviral CAR construct expressing H84T banana lectin binder with intracellular 41BB costimulatory domain and CD3z signaling domain. (B) H84T CAR expression was determined by flow cytometry with a rabbit anti-H84T antibody and goat anti-rabbit IgG Alexa Fluor 488 secondary antibody. Representative staining of one donor is shown in the plots on the left (left: non-transduced T cells; right: H84T CAR transduced). The average of six healthy donor T-cell transductions is quantified as percent CAR expression. (C) Average of five T-cell donor counts post transduction calculated by trypan blue counts. (D) Non-transduced (NT) and H84T CAR T cell CD4:CD8 ratio on day 14 post transduction quantified by flow cytometry. (E) Day 14 T-cell memory phenotype for CD4 (left) and CD8 (right) T cells. Memory T-cell populations were determined by cell surface expression of CCR7 and CD45RA staining quantified by flow cytometry. CAR, chimeric antigen receptor; Tcm, central memory; Teff, T effector cells; Temra, T cell effector memory.

