Figure 4.
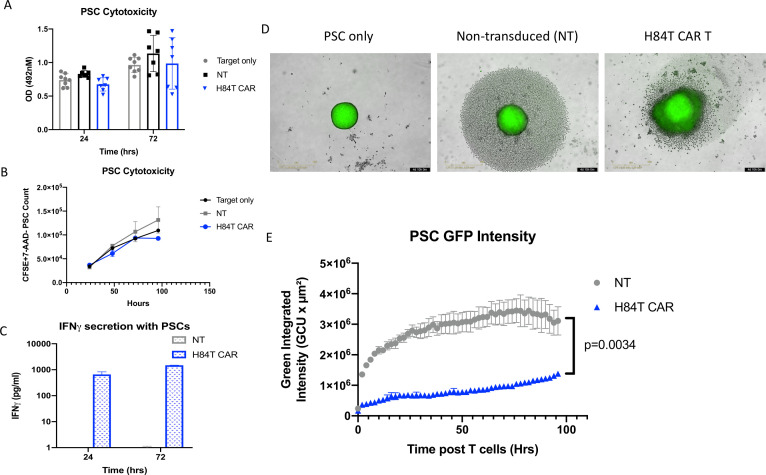
Anti-stromal activity of H84T CAR T cells against PSCs. (A) 4×10⁴ primary PSCs were seeded in 96-well plates and 1×10⁴ NT or H84T CAR T cells were added. PSC cell viability was determined by MTS assay at 24 hours and 72 hours post T-cell addition. Optical density (OD) values were obtained at 492 nm wavelengths. Averages of three technical triplicates of seven different donor T cells are represented. (B) Primary PSCs were stained with CSFE and cultured with NT or H84T CAR T cells are 4:1 ratio. Residual viable PSCs were detected by CSFE+7-AAD– and quantified by absolute count bright beads via flow cytometry. (C) Supernatant from PSCs cultured with NT or H84T CAR-T cells were collected 24 and 72 hours post T-cell addition (1:4 effector:target ratio). IFN-γ secretion was measured by ELISA assay. Averages of three donors are represented. (D) 4×10³ PSCs labeled with CSFE were seeded in 1% agarose coated 96-well plates and allowed to form spheroids for 24 hours. 2×10³ NT or H84T CAR T cells were then added and images were acquired every 2 hours for 4 days by the Incucyte Live imaging system. Representative image of one donor T cell and spheroids is shown 96 hours post T-cell addition. (E) The green integrated intensity of CSFE labeled PSC spheroids were quantified by Incucyte Live image analysis post T-cell addition over time. Results are an average of four technical replicates of three different donors. P value determined by two-way analysis of variance. CSFE, Carboxyfluorescein succinimidyl ester; 7-AAD, 7-aminoactinomycin D; GFP, green fluorescent protein; CAR, chimeric antigen receptor; IFN, interferon; PSC, pancreatic stellate cells.

