Figure 5.
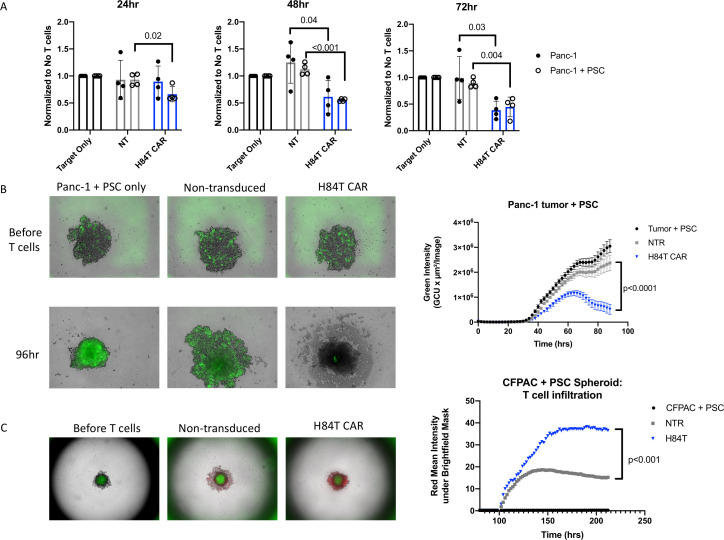
Activity of H84T CAR T cells in heterogenous pancreatic ductal adenocarcinoma tumor models. (A) 2×10⁴ Panc-1 cells only or in combination with 2×10⁴ PSCs were cultured for 24 hours in 96-well plates. 5×10³ NT or H84T CAR T cells were then added and total viable tumor and PSCs were determined by MTS assay. Optical density was measured at 492 nm and tumor only control was normalized to 1. Measurements were acquired at 24 hours, 48 hours, and 72 hours post T-cell addition. (B) 2×10³ GFP labeled Panc-1 tumor cells and 8×10³ PSCs were co-cultured in 1% agarose coated 96-well plates for 48 hours. 1×10³ NT or H84T CAR T cells were then added and imaged on the Incucyte Live imaging system for another 48 hours. GFP intensity of tumor cells was quantified over time (right) and representative images at time 0 hour and 96 hours post T cells are shown. P value<0.001 determined by two-way analysis of variance (ANOVA). (C) 2×10³ GFP labeled CFPAC-1 tumor cells and 8×10³ PSCs were co-cultured in 1% agarose coated 96-well plates for 96 hours. 1×10³ NT or H84T CAR T cells labeled with cell tracker red were then added and spheroids were imaged every 2 hours on the whole well spheroid imaging setting. Spheroid images before T cells were added and 96 hours post T-cell addition is shown on the left. The red intensity of T cells quantified under the brightfield mask is graphed on the right (p<0.001 determined by two-way ANOVA). Quantification for determining T-cell signal within spheroids are further described in online supplemental figure 5. CAR, chimeric antigen receptor; PSC, pancreatic stellate cells; NT, non-transduced; GFP, green fluorescent protein; MTS, MTS Tetrazolium assay.

