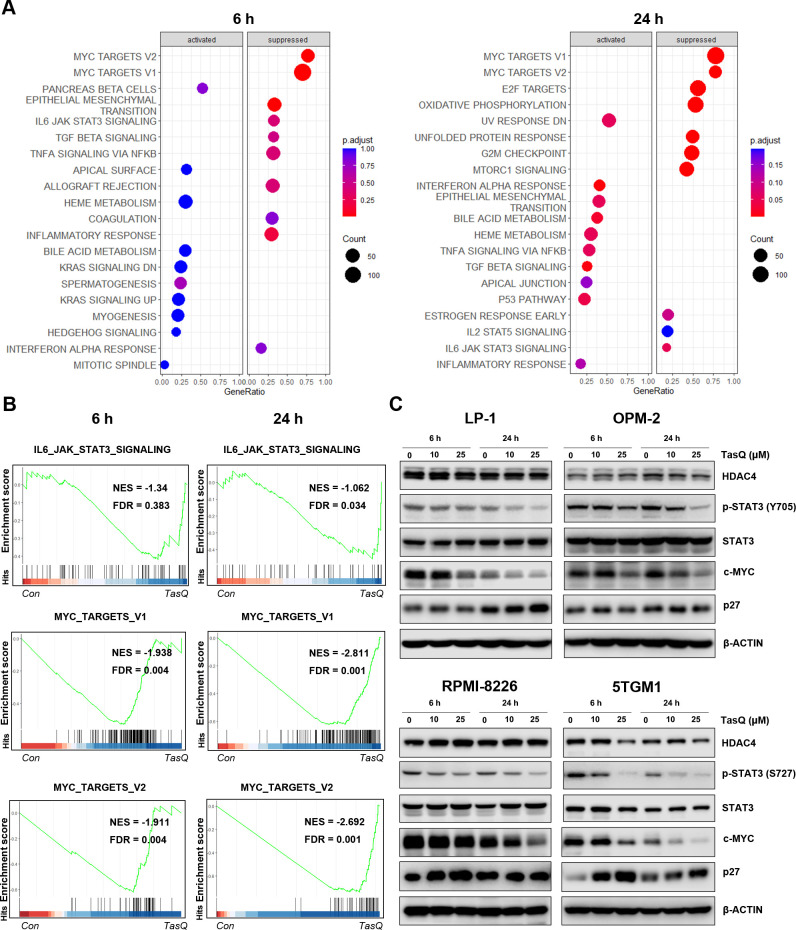
Figure 2.
Tasquinimod-mediated downregulation of c-MYC expression in MM cells in vitro. (A) The bubble plot shows the top 20 differentially regulated (activated/suppressed) pathways in the tasquinimod-treated group compared with the control group (6, 24 hours) (n=3). (B) Gene set enrichment analysis (GSEA) of the IL6-JAK-STAT3 and MYC targets V1, V2 gene signature in LP-1 cells after treatment with either 25 µM of tasquinimod or DMSO for 6 hours and 24 hours. GSEA of differentially expressed genes was determined by querying the MSigDB. False discovery rate (FDR) and normalized enrichment scores (NES) are indicated (n=3). (C) LP-1, OPM-2, RPMI-8226 and 5TGM1 cells were cultured with tasquinimod (TasQ) (10, 25 µM) for 6 hours and 24 hours. Whole-cell lysates were subjected to Western blot using HDAC4, anti-Phospho-Stat3 (Tyr705, S727), anti-Stat3, anti-c-MYC, anti-p27 Kip and anti-β-Actin antibodies (n=5). HDAC4, histone deacetylase 4.

