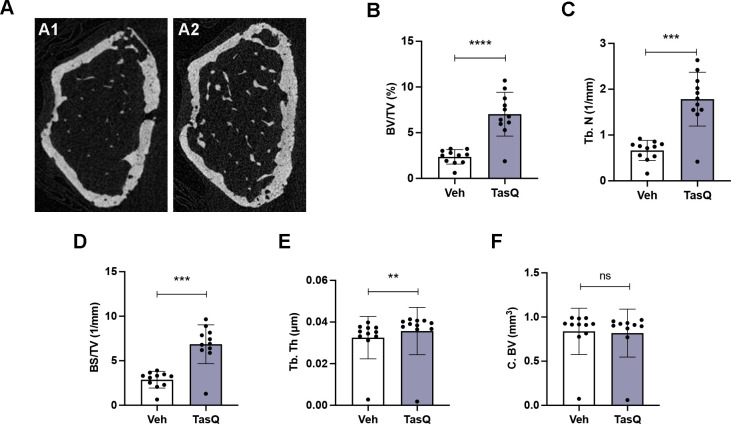
Figure 6.
Tasquinimod therapy resulted in increased trabecular bone volume in vivo. (A) Three-dimensional reconstructions of micro-CT scans of the representative femur from vehicle (A1) and tasquinimod-treated 5TGM1 mice (A2). (B) Percentage of bone volume over total volume or bone volume fraction (BV/TV). (C) Trabecular number (Tb.N). (D) Surface density (BS/TV). (E) Trabecular thickness (Tb. Th). (F) Cortical bone volume (C. BV). **p<0.01, ***p<0.001, ****p<0.0001, Mann-Whitney U test. Error bars indicate SD, n=10 per group.

