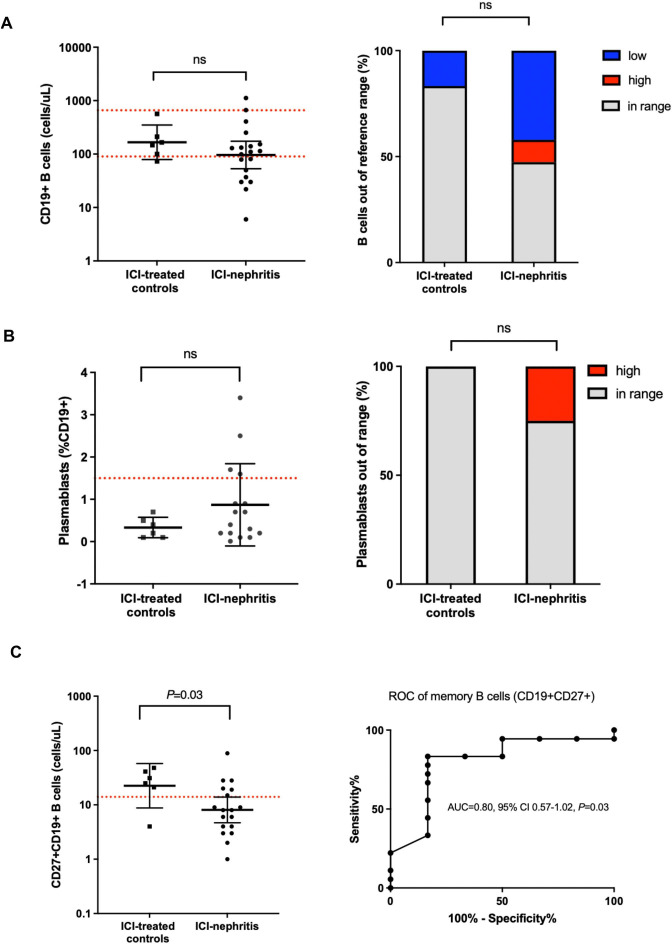
Figure 4.
Peripheral blood B cell markers are altered in ICI-nephritis. (A–C) B cell subsets, shown as absolute count in log scale, plasmablasts as % total CD19+B cells, or out-of-range B cells as % total unique individuals as indicated and compared between ICI-treated controls (N=6; squares) and ICI-nephritis (N=19; circles). Symbols represent unique individuals; bars represent geometric means (95% CIs) of total indicated patients. Red dotted lines indicate the assay lower or higher limit of normal. ROC curve of absolute (cells/μL) peripheral memory B cells (CD27+CD19+) shown in 4C (right). Area under the curve (AUC), 95% CI, and p values shown. ICI, immune checkpoint inhibitor; ns, not significant; ROC, receiver operating characteristic.

