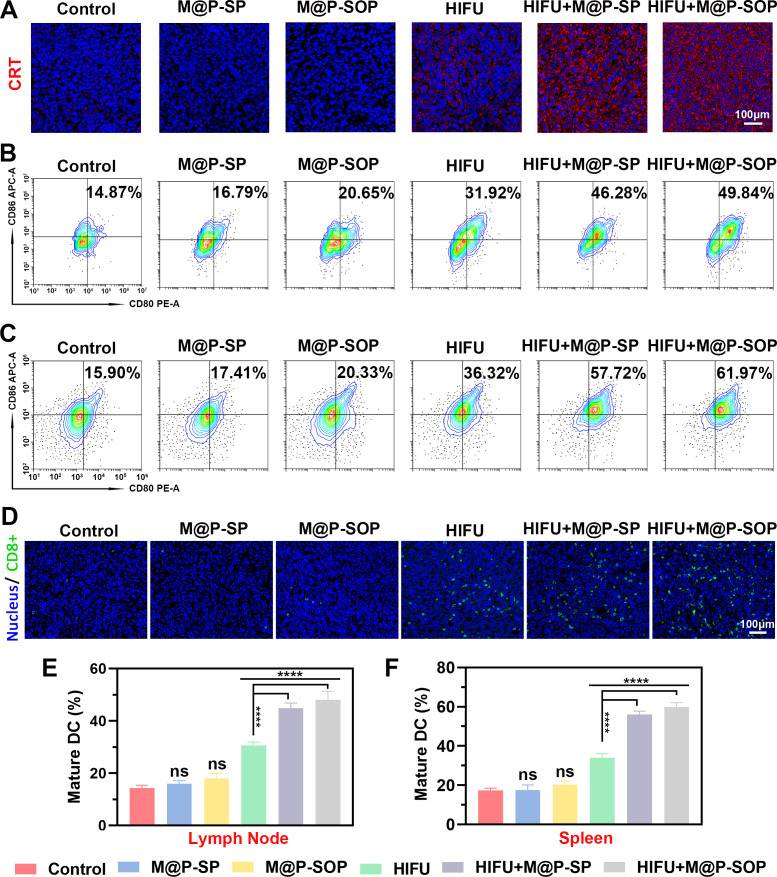
Figure 5.
In vivo therapeutic mechanism of M@P-SOP with HIFU. (A) Immunofluorescence staining of CRT in tumor slices after various treatments. (B, C) FCM analysis of DCs maturation in lymph nodes (B) and spleen (C) initiated by various treatments in vivo. (D) Immunofluorescence images of tumor slices displaying population of CD8-positive cells for various groups of mice. (E, F) Statistical data of (B, C) respectively (n=3, one-way ANOVA, ****p<0.0001). ANOVA, analysis of variance; DC, dendritic cell; FCM, flow cytometry; CRT, calreticulin; HIFU, high-intensity focused ultrasound; ns, not significant.

