Figure 1.
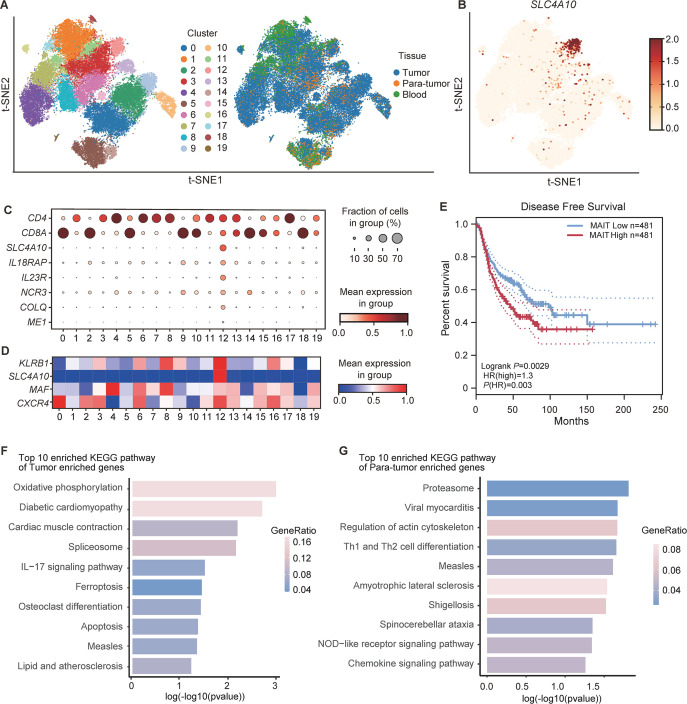
The abundance and transcriptional profiles of MAIT cells in non-small cell lung cancer (NSCLC) patients based on scRNA-seq data (14 patients from GSE99254 and 11 patients from GSE162498). (A) t-Distributed Stochastic Neighbor Embedding (t-SNE) plot displaying 20 clusters identified on the basis of gene expression levels of CD3+ T cells in peripheral blood, tumor, and paratumor tissues from NSCLC patients. Cells are colored according to the 20 clusters defined in an unsupervised manner. (B) Expression of SLC4A10 in CD3+ T cells from peripheral blood, tumor and paratumor tissues of NSCLC patients. (C) Dot plot for markers characterizing MAIT cells with tumor-homing properties in NSCLC patients. The color intensity of each dot corresponds to the average gene expression across all cells in each cluster. (D) Dot plot for selected markers characterizing mucosal-associated invariant T (MAIT) cells with tumor-homing properties (cluster 12) that were reported previously.21 The color intensity of each dot corresponds to the average gene expression across all cells in each cluster. (E) Kaplan-Meier curves for disease-free survival (DFS) according to MAIT cell frequency in NSCLC patients from the TCGA database. (F) The top 10 enriched KEGG pathway of tumor enriched genes in MAIT cells from NSCLC patients. (G) The top 10 enriched KEGG pathway of paratumor enriched genes in MAIT cell from NSCLC patients. Survival analysis was determined by the log-rank (Mantel-Cox) test.

