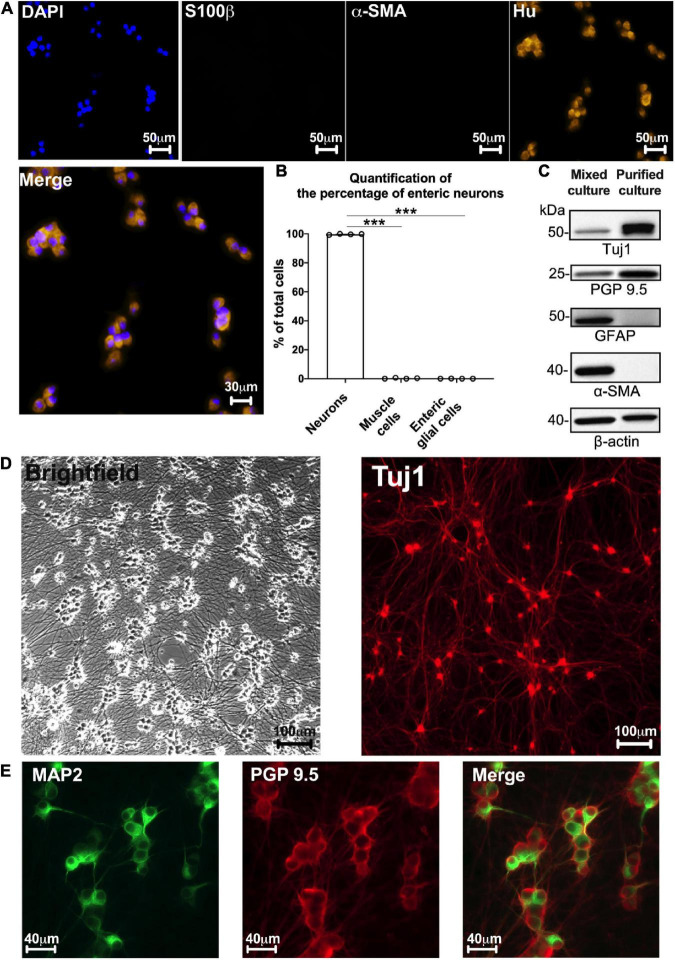
FIGURE 2.
Highly pure culture of rat enteric neurons. (A) Staining for cell nucleus (DAPI) and immunostaining for enteric neurons (Hu), glial cells (S100b), and myofibroblasts (α-SMA) at D7 culture. (B) Quantification of the percentage of enteric neurons, glial cells and myofibroblasts in cultures at D7 (Data are presented as mean ± SEM from 644 neurons analyzed from n = 4 culture wells from 4 independent rat embryos). (C) Representative western blot from ENS mixed cell culture (muscle, glia, and neuronal cells) and highly pure culture of enteric neurons (n = 4 culture wells from 4 independent rat embryos). (D) Brightfield and immunostaining for TUJ1 in culture at D7. (E) Double immunostaining of enteric neurons at D7 with the somatodendritic marker MAP2 (green) and PGP 9.5 (red) (n = 3 culture wells from 3 independent rat embryos). Results were compared using one-way ANOVA and post-hoc Tukey’s test (***p < 0.001).

