FIGURE 5.
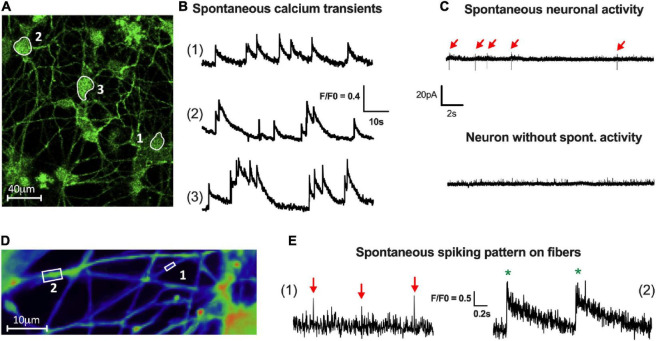
Activity of enteric neurons within the network. (A,B) Fluorescence images (A) of a field containing neuronal cell bodies with spontaneous activity (1, 2 and 3). (B) Representative traces of three types of spontaneous Ca2+ activity defined as isolated (1), moderately clustered (2) and tightly clustered transients (3) (70 neurons analyzed from n = 4 cultures from 4 independent rat embryos). (C) Representative traces of spontaneous spiking pattern in patch clamp cell-attached configuration (15 neurons analyzed from n = 5 cultures from 5 independent rat embryos). (D) Fluorescence images of a field containing neuronal fibers of small (boxed region 1) and large (boxed region 2) caliber with spontaneous activity visualized by VSD imaging. (E) Representative traces of isolated spikes (red arrow) on small caliber fibers (1) or compound potentials (green*), composed of several spikes, on large caliber fibers (2) (15 fibers analyzed from n = 4 cultures from 4 independent rat embryos).

