FIGURE 7.
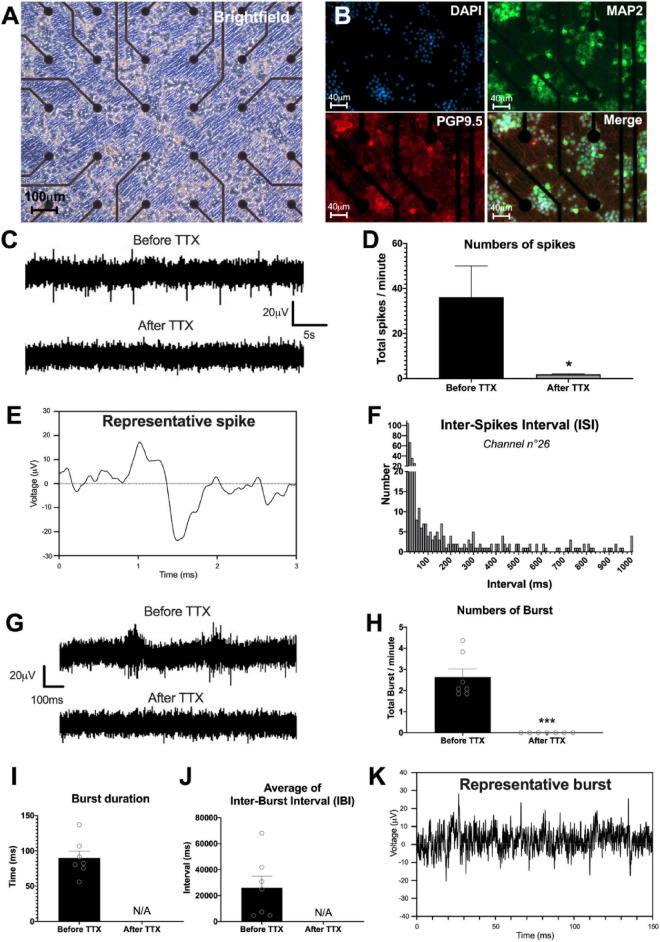
Enteric neuronal network activity. (A–K) Analysis of neural network activity of highly pure cultures of enteric neurons by multi-electrode array (MEA) at D28. (A,B) Representative image of enteric neurons in MEA, (A) brightfield and (B) double immunostaining of enteric neurons at D28 with neuronal marker PGP 9.5 (red), MAP2 (green) and the cell nucleus marker DAPI (blue). (C) Representative voltage recording at one electrode, showing spontaneous firing and its inhibition by TTX treatment. (D) Numbers of spikes per minutes before and after TTX, average of 15 electrodes. (E) Detail of a representative enteric neuron spike measured by MEA. (F) Histogram representing an example of Inter-Spike Interval (ISI) measured on one electrode (n°26). (G) Single electrode recordings showing examples representative traces of two consecutive burst before and after TTX treatment. (H–J) Different parameters of burst measured by MEA before and after addition of TTX in the culture, i.e., (H) numbers, (I) duration, and (J) average of inter-burst interval. (K) Detail of a representative burst trace measured by MEA. Results were compared using t-test (*p < 0.05; ***p < 0.001). Data are presented as mean ± SEM of n = 3 chips from 3 independent rat embryos.

