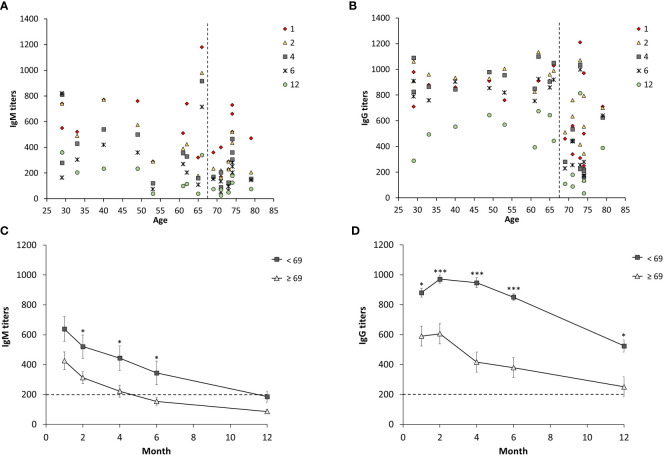
Figure 2.
Age-dependent IgM and IgG serum titers from 19 individuals diagnosed with ulceroglandular tularemia. Diagram (A, B) show individual IgM and IgG titers respectively. Diagram (C) and (D) show mean values ± SEM of IgM and IgG, respectively, in individuals < 69 years (n = 10) and ≥ 69 years (n = 9) at a given time point. Stars indicate significant differences between the two age groups at a given time point (*p < 0.05, ***p < 0.001).

