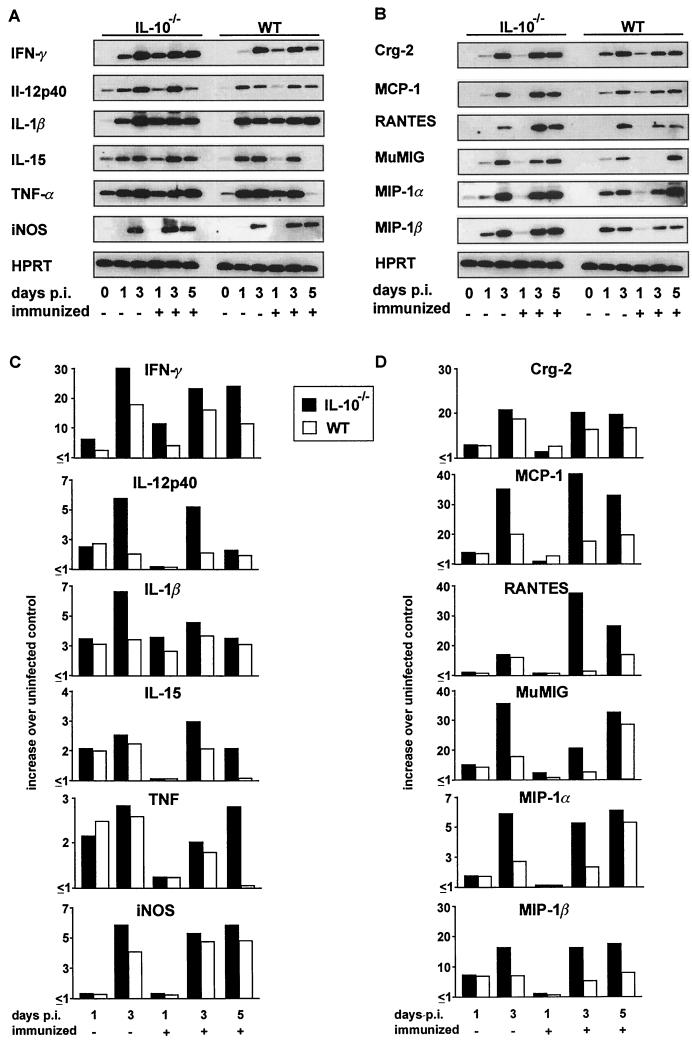
FIG. 5.
RT-PCR analysis of cytokine (A) and chemokine (B) mRNA production in the L. monocytogenes-infected brain. At the indicated time points, three mice per experimental group were analyzed, and representative autoradiograms are shown. The relative levels of cytokine (C) and chemokine (D) mRNA expression in the brain are shown. Data are expressed as relative increase over cytokine and chemokine mRNA levels in uninfected mice from the respective mouse strain. Values represent data from one of three independent experiments, which yielded similar results.

