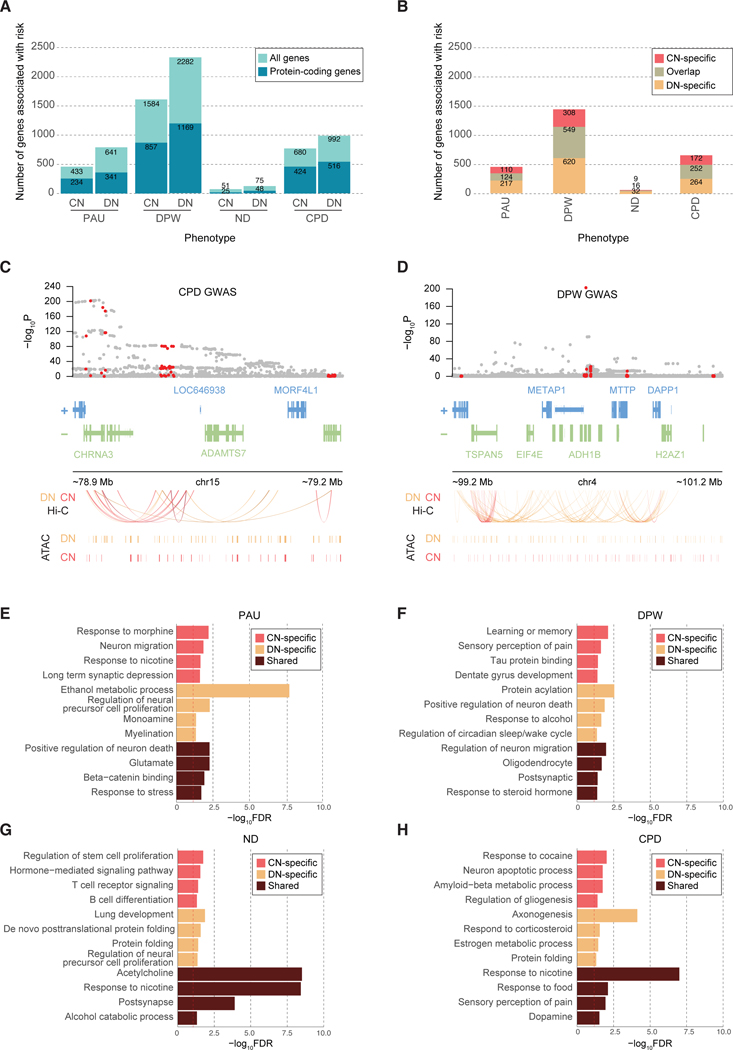
Figure 2. Genes and pathways associated with cigarette smoking and alcohol use traits.
A. The number of risk genes for cigarette smoking and alcohol use traits based on H-MAGMA built from CN and DN Hi-C data (FDR<0.05). For each stacked bar plot, an upper bar plot and number in light blue denote all genes, whereas a lower layer and number in dark blue correspond to protein-coding genes. B. The number of protein-coding genes associated with smoking and alcohol use traits by CN H-MAGMA only (CN-specific), DN H-MAGMA only (DN-specific), and by both CN and DN H-MAGMA (overlap) at an FDR threshold of 0.05. C. H-MAGMA identifies CHRNA3 to be associated with CPD. From top to bottom, we display the GWAS variant association, gene model, Hi-C loops, and CREs. GWAS variant association, gray dots represent all SNPs in the locus, red dots represent SNPs annotated to CHRNA3 via H-MAGMA (either DN or CN). Hi-C loops and CREs, red and orange lines represent the regulatory architecture of CNs and DNs, respectively. D. H-MAGMA identifies ADH1B to be associated with DPW. Red dots in the GWAS association represent SNPs annotated to ADH1B via H-MAGMA (either DN or CN). E-H. Gene ontologies (GO) enriched for PAU (E), DPW (F), ND (G), and CPD (H). CN-specific GO terms represent terms unique to genes identified from H-MAGMA built on CN Hi-C data, while DN-specific GO terms represent terms unique to genes identified from H-MAGMA built from DN Hi-C data. Shared terms denote GO terms detected in both CN and DN H-MAGMA results. The dotted red line denotes FDR=0.05.

