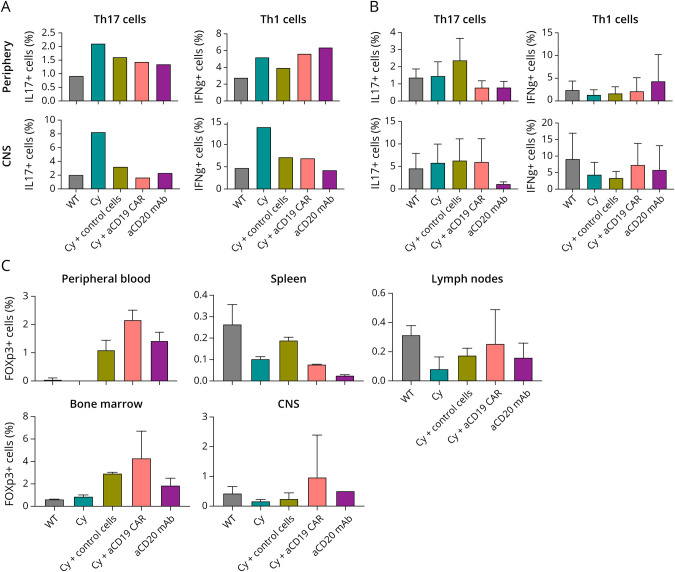
Figure 3. Endogenous T Cell Response Based on Treatment.
(A) Frequency of CD45+CD4+IL17+ (Th17) or CD45+CD4+IFNg+ (Th1) cells of 1 mouse per disease cohort from periphery (spleen) or CNS (brain and spinal cord) on day 17 postimmunization. (B) Frequency of CD45+CD4+IL17+ (Th17) or CD45+CD4+IFNg+ (Th1) cells, average of 3 mice per disease cohort from periphery (spleen) or CNS (brain and spinal cord) on day 28 postimmunization (C) Frequency of CD4+CD25+FOXp3+ cells average of 2 mice per disease cohort per compartment on day 28 postimmunization. Shown is average ± SD.

