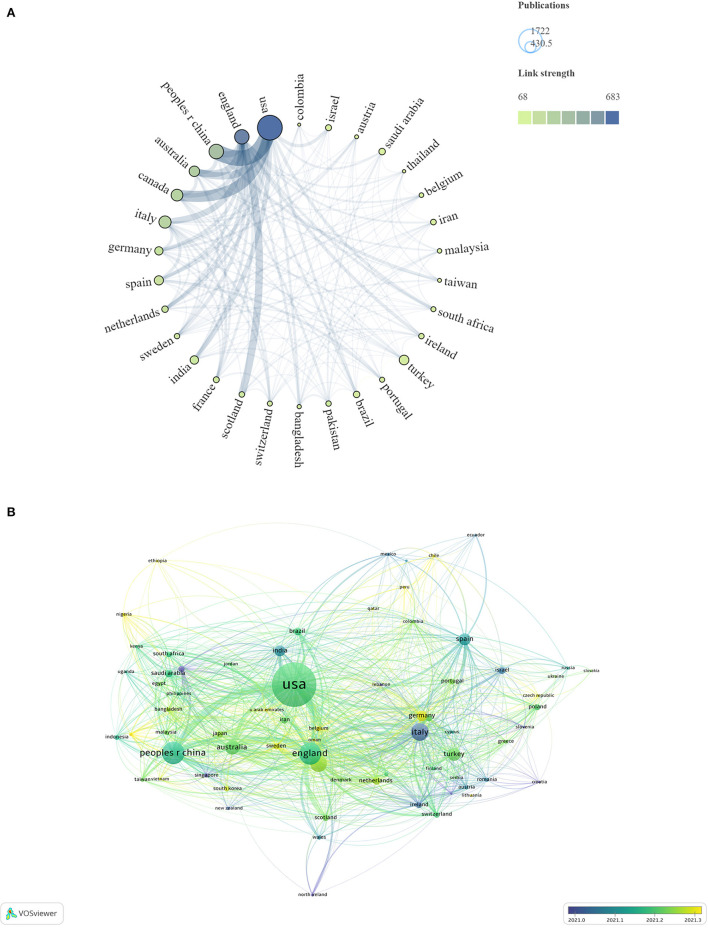
Figure 2.
Geographical distribution in the past 3 years (A). The size of the circle displays the number of publications, and the thickness of links represents cooperation strength between countries. Overlay Geographical visualization was based on publication-weights and average publication year scores (B).

