
Figure 5: Mitophagy regulates apoptotic resistance in TH17s.
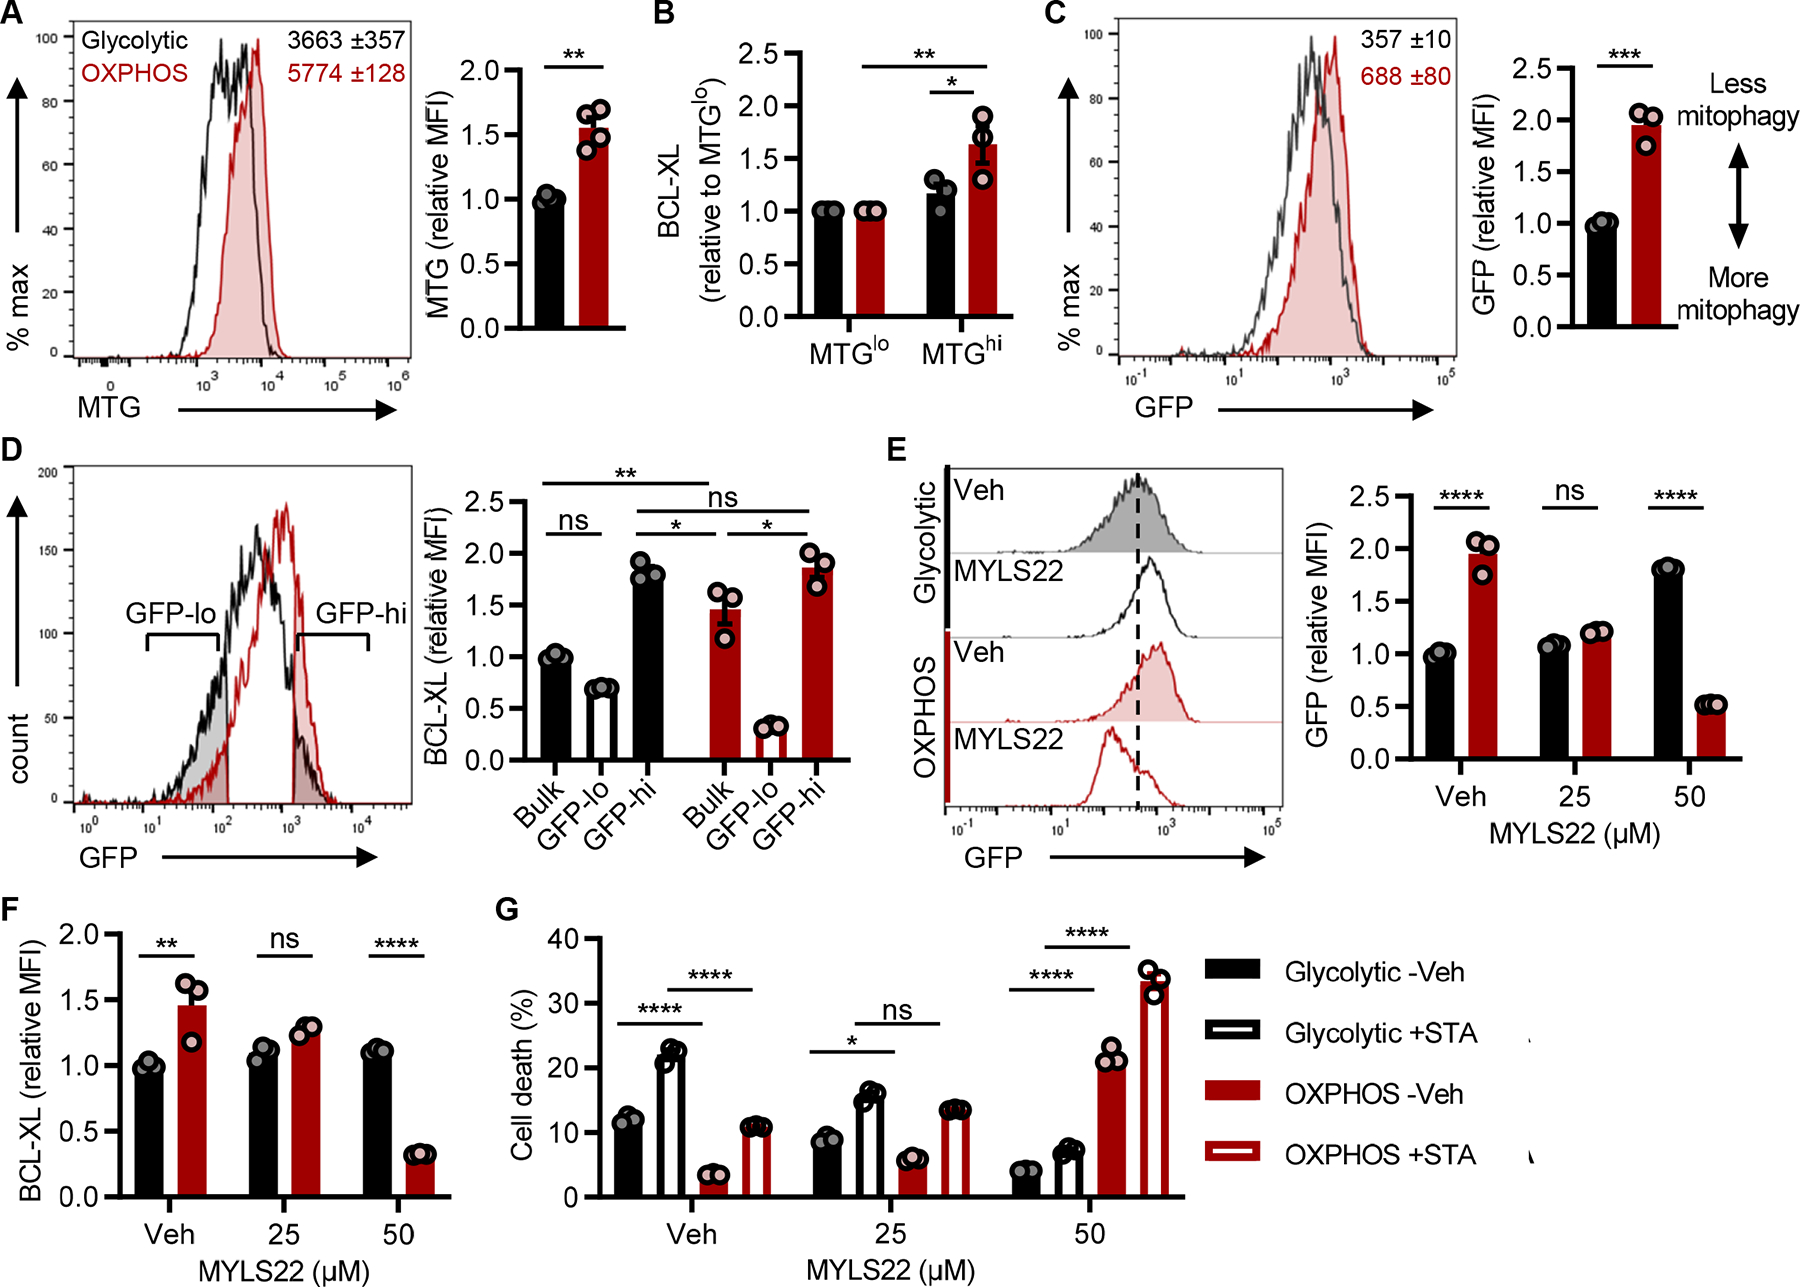
(A) MitoTracker Green (MTG) staining in TH17s to assess mitochondrial mass. Representative flow histogram (left) includes MFI ±SEM of 3 technical replicates and accompanying quantification (right) of MTG in live-gated CD4+ TH17s from n=4 experiments.
(B) BCL-XL expression in TH17s with the least or most amount of mitochondrial mass. MTG-stained TH17s were flow sorted based on the 20% lowest and highest MFI, and then stained for BCL-XL (n=3).
(C-G) Naïve CD4 T cells were isolated from lymphoid tissues of mitoQC mice and polarized to the TH17 lineage under glycolytic or OXPHOS conditions. (C) Mitophagy activity was based on the loss of GFP detection which was quantified by flow cytometry. Representative flow histogram (left) includes MFI ±SEM of 3 technical replicates and accompanying quantification (right) in live-gated CD4+ TH17s from n=3 experiments.
(D) BCL-XL expression in bulk cultures or in the cells undergoing the most vs. least mitophagy. GFP-lo and GFP-hi gates were based on the 25% lowest and highest GFP MFI populations in glycolytic and OXPHOS MitoQC TH17s, respectively. Representative flow histogram (left) illustrates GFP gating strategy and accompanied by quantification of relative BCL-XL (right) from n=3 experiments.
(E and F) MitoQC TH17s were polarized +/− MYLS22 for 4 days to inhibit OPA1-mediated mitochondrial fusion. (E) Representative flow histogram (left) and accompanying quantification (right) of mitophagy activity was based on GFP MFI in live-gated TH17s. (F) Parallel analysis of BCL-XL expression in TH17s +/− MYLS22 (n=3).
(G) MitoQC TH17s were polarized +/− MYLS22 for 4 days and then challenged with 2μM staurosporine (STA) for 4hrs to induce apoptosis. Frequency of cell death (AnnexinV+7-AAD+) was quantified by flow cytometry (n=3).
All data are mean ±SEM and data represent at least one of two independent experiments. Statistical significance was determined by (A, C) two-tailed unpaired t-test or (B, D-G) two-way ANOVA (*p<0.05; **p<0.01; ***p<0.001; ****p<0.0001).