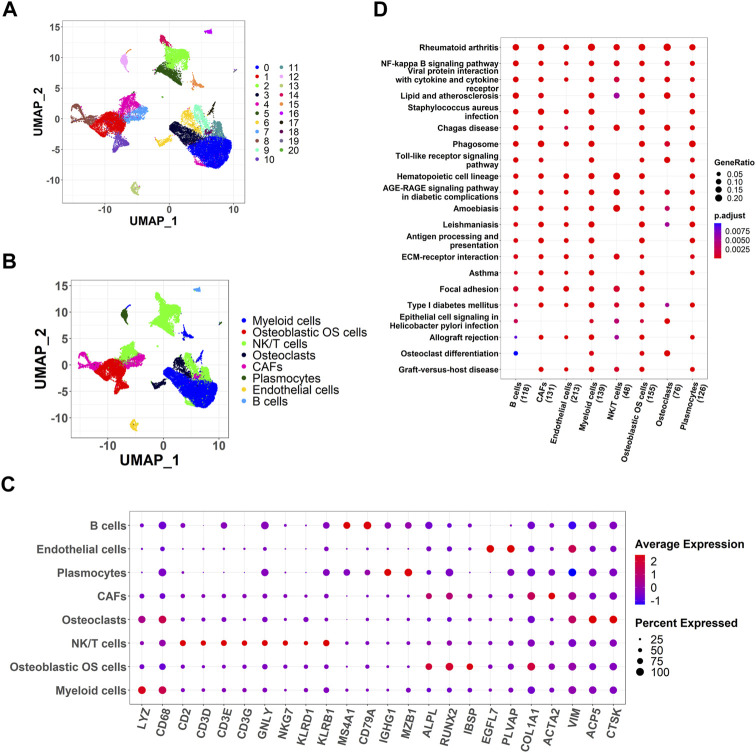
FIGURE 1.
Identification of cell clusters and dimension reduction analysis. (A) Twenty-one cell clusters of dimension reduction analysis; (B) Ten cell types were identified by marker genes; (C) The expression of marker genes in eight cell types; (D) Kyoto Encyclopedia of Genes and Genomes (KEGG) enrichment analysis for marker genes of eight cell types.

