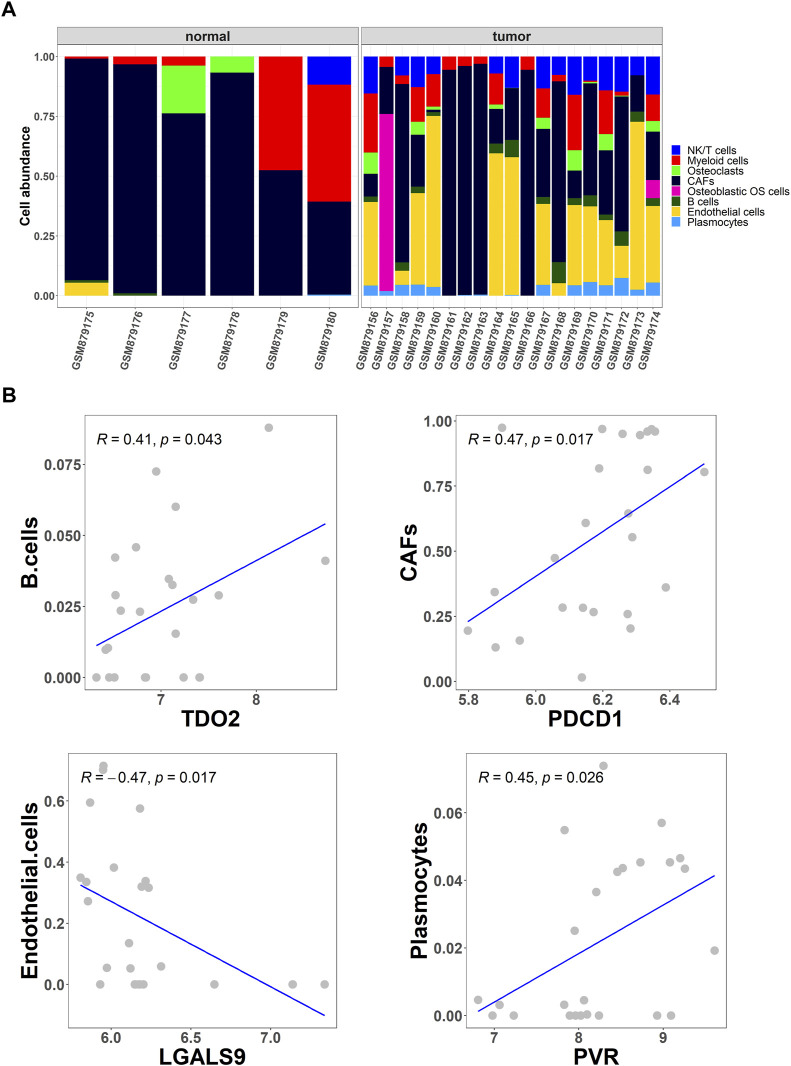
FIGURE 2.
Collection of differential cell types. (A) The CIBERSORT algorithm was used to obtain the differential abundance of eight cell types in OS and normal tissues from the GSE36001 dataset; (B) Scatter plot of the correlation between the abundance of the four cell types (B cells, cancer-associated fibroblasts (CAFs), endothelial cells, and plasmocytes) and the expression of immune checkpoints TDO2, PDCD1, LGALS9, and PVR.

