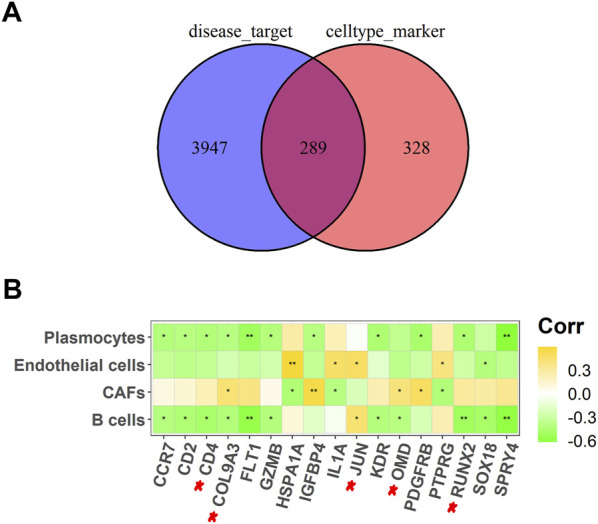
FIGURE 3.

Screening out key targets for OS. (A) A Venn diagram of OS-related targets and four different cell types marker genes; (B) Heat map of 17 potential targets correlated with cell abundance in B cells, CAFs, endothelial cells, and plasmocytes. *p <.05, **p <.01.
