FIGURE 1.
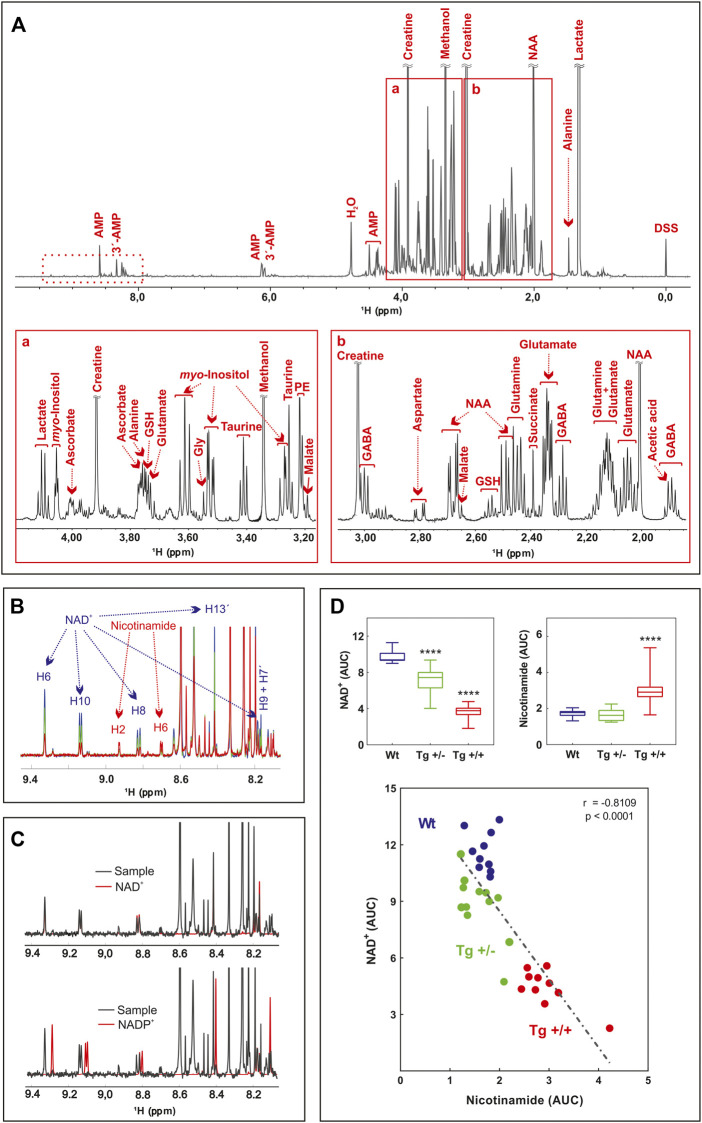
Untargeted 1H-NMR metabolomics of hippocampus of AD-like amyloid pathology transgenic rats (A) Typical 600 MHz 1H-NMR spectrum of WT rats, representative of all the registered spectra. Assigned resonances of specific metabolites are indicated in red. Expanded views of the spectrum between 3.1–4.4 ppm (A) and 1.7–3.2 ppm (B) are shown (B) Overlaid of averaged 1H-NMR spectra of WT rats (blue) (n = 10), Tg +/- (green) (n = 12) and Tg+/+ (red) (n = 10) in the 9.5–8.0 ppm zone (dashed box in A). The resonances assigned to NAD and Nam protons are indicated (C) Overlaid of representative 1H-NMR spectra of WT rats (black, sample), NAD standard (red, upper panel) and NADP standard (red, lower panel) (D) Lower panel: correlation between NAD and Nam levels of samples analyzed. The AUC of H6 of NAD and H2 of Nam were plotted (n = 32). The linear regression (dashed line), the Pearson’s correlation coefficient and the p-value (two tailed) are shown. Upper panels: differences in the AUC of NAD (left) and Nam (right) among groups (WT, blue; Tg+/-, green and Tg+/+, red) were analyzed by one-way ANOVA. Significant differences are indicated accordingly to Fishers´s LSD test. ****p < 0.0001.

