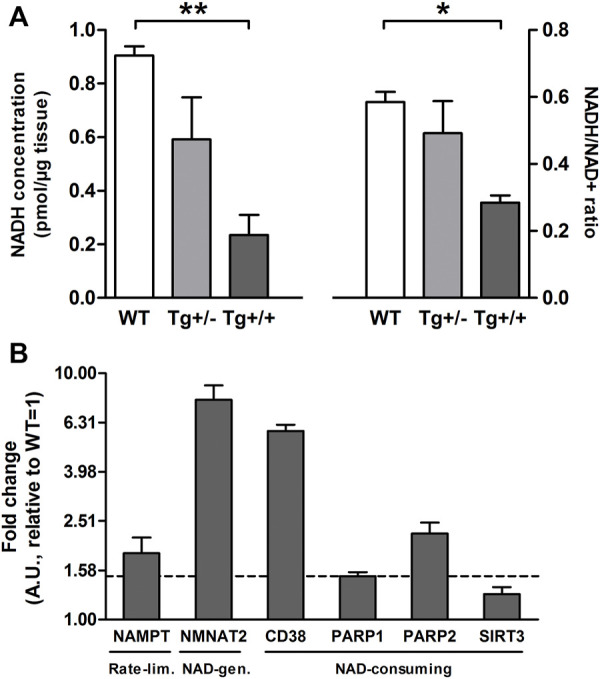
FIGURE 2.

Hippocampal Aβ deposition alters the brain NAD + metabolism (A) Bars show mean ± SEM levels of NADH (left panel) and NADH/NAD + ratio (right panel) in hippocampal homogenates of control (WT; n = 3), hemizygous (Tg+/; n = 3) and homozygous (Tg+/+; n = 3) transgenic rats. One-way ANOVA tests and post hoc analyses revealed that Tg+/+ showed significantly lower levels of NADH (F(2, 6) = 10.76, p = 0.01; post-hoc: **p < 0.01) and NADH/NAD + ratio (F(2, 6) = 6.71, p = 0.02; post-hoc:*p < 0.05) compared with those observed in WT (B) Transcript levels of rate-limiting (NAMPT), NAD + -generation (NMNAT2) and NAD + consuming enzymes (CD38, PARP1, PARP2 and SIRT3) in hippocampal homogenates of Tg+/+ rats. Each bar represents the mean ± SEM of at least three independent experiments performed by triplicate for each sample normalized by GAPDH or Eukaryotic Translation Elongation Factor 1 Alpha 1 (EEF1A1). The mean ± SEM relative to WT (=1) is shown. Values above the dashed line (+1.5) were considered different from WT (=1).
