
Figure 8.
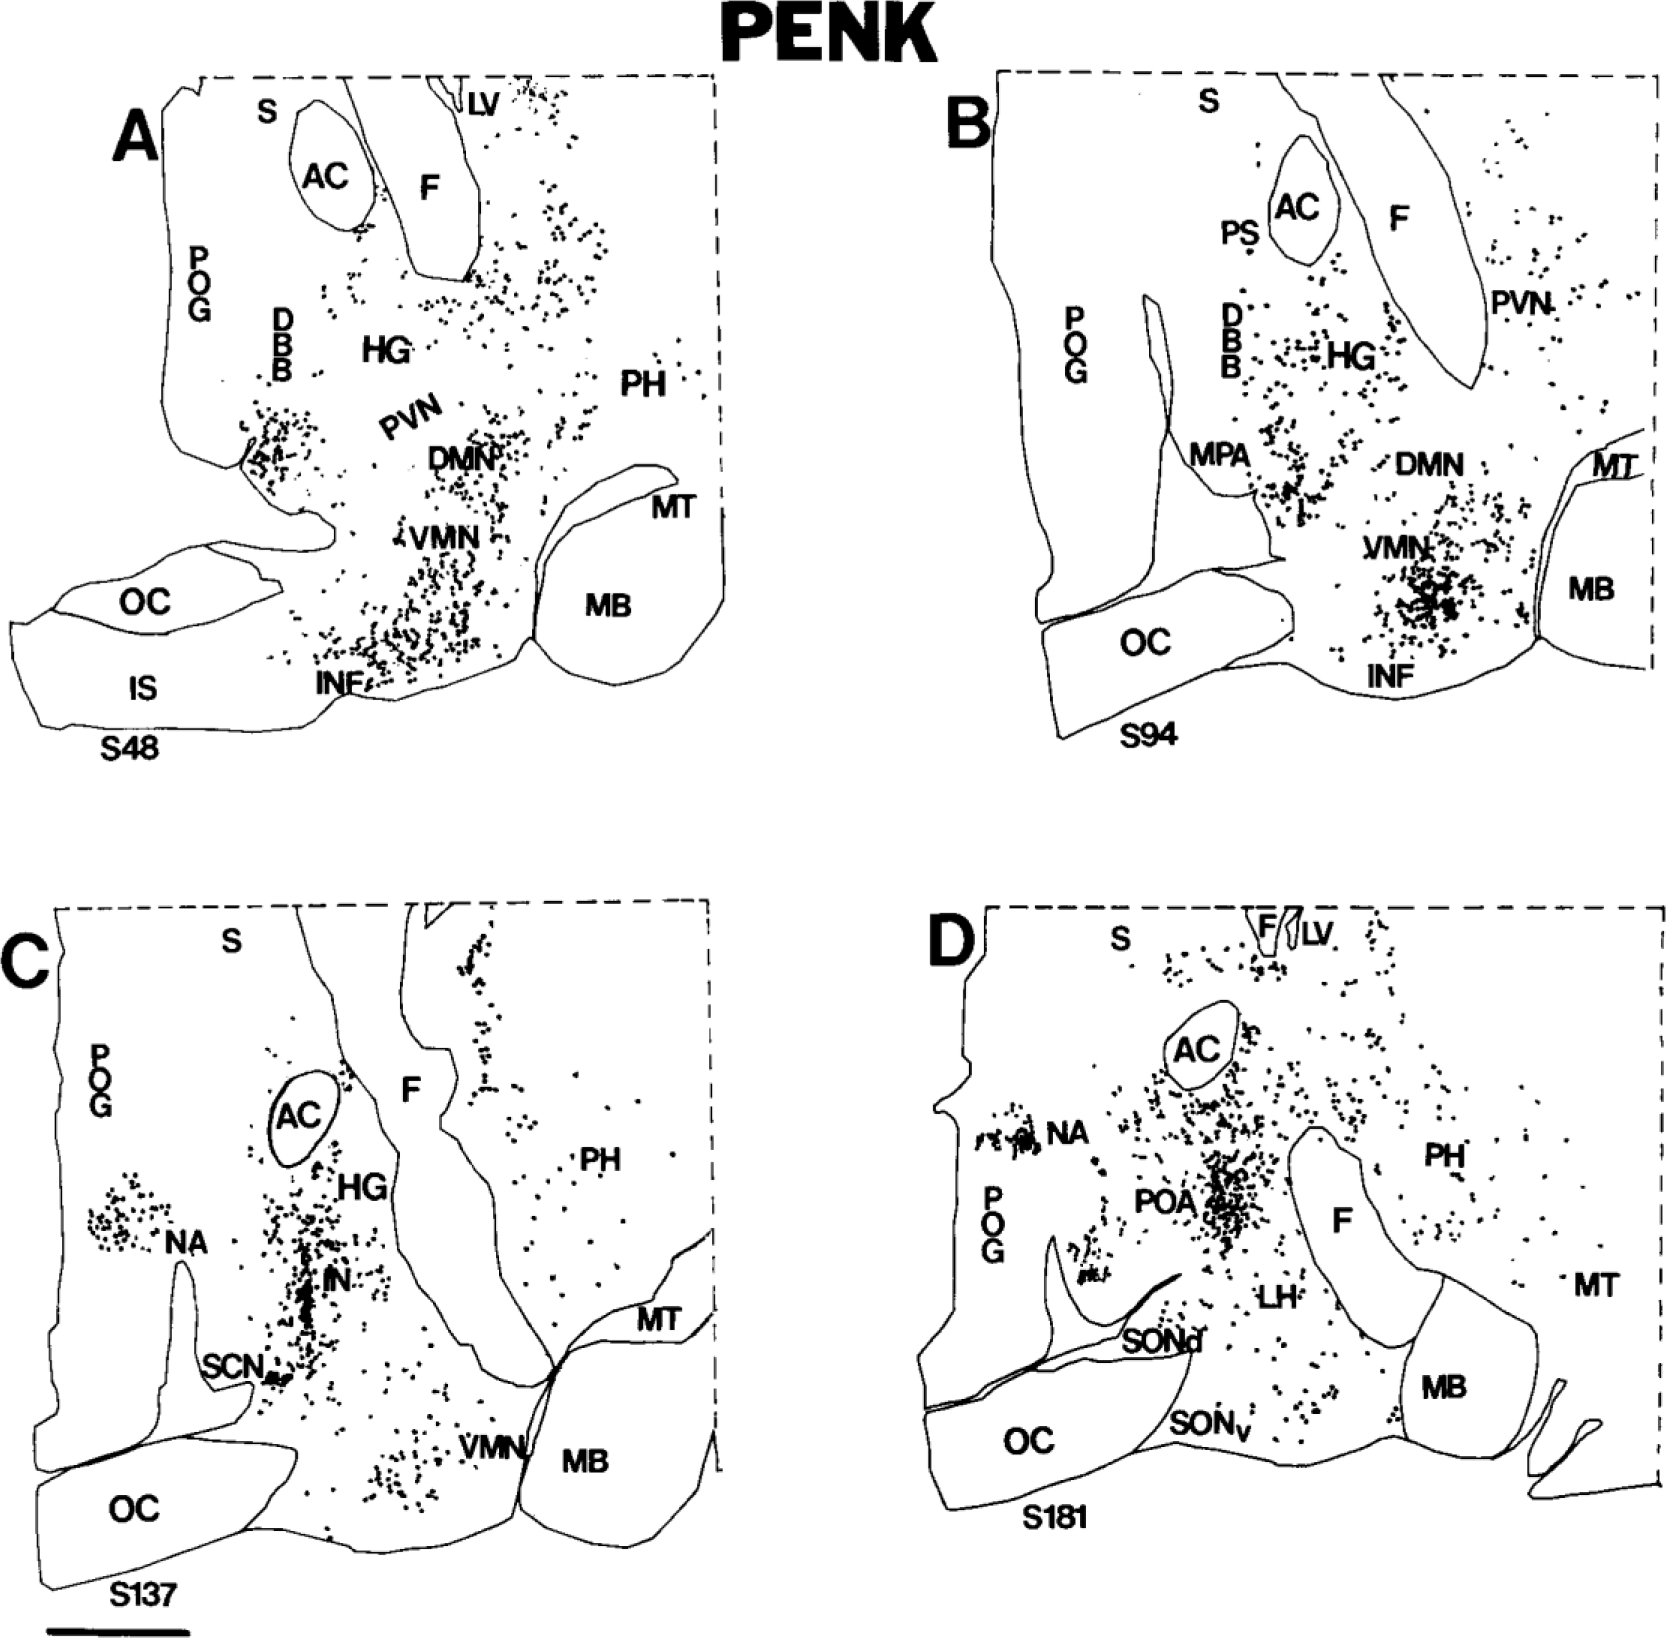
A-D: Computer-assisted maps of the distribution of PENK cells in 20-micron-thick sagittal sections of the human hypothalamus. The most medial section is A, and the most lateral section is D. Each dot represents a single neuron. Scale bar = 5 mm.