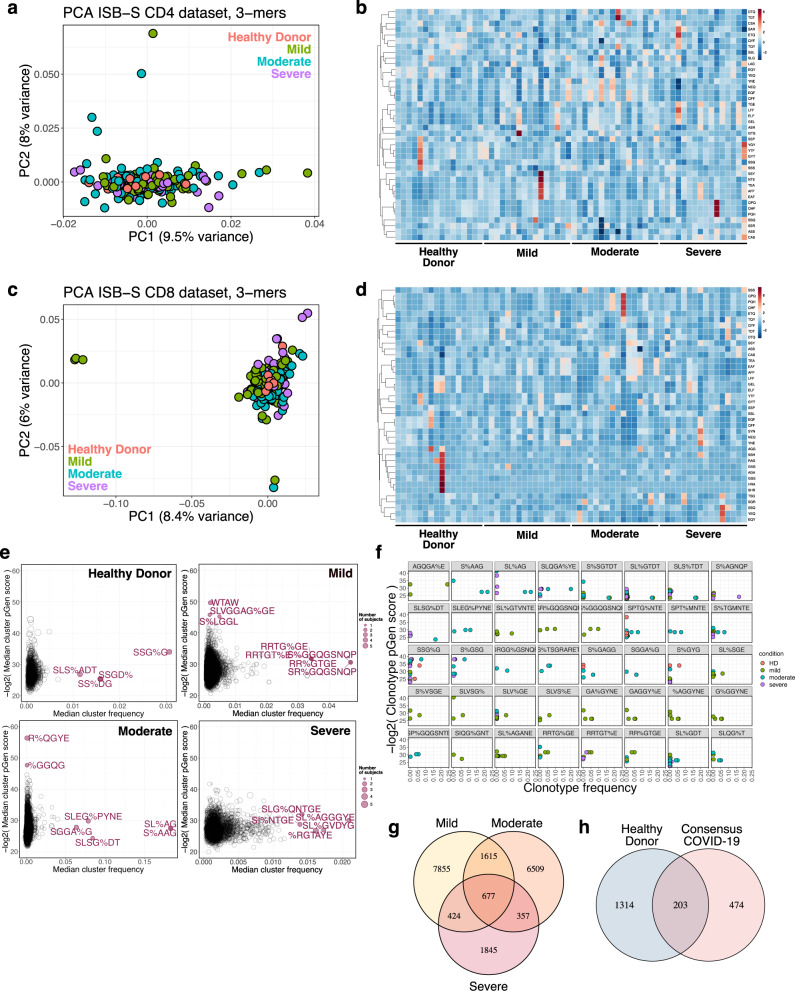
Fig. 2. K-mer and motif analyses reveal patterns associated with disease condition.
a Principal components analysis of 3-mer representations of TCR repertoires from the ISB-S CD4 dataset (n = 266). b Heatmaps of 3-mer abundances of a random sample of repertoires from the ISB-S CD4 dataset by disease condition (healthy donor = 16, mild = 16, moderate = 16, severe = 16). c Principal components analysis of 3-mer representations of TCR repertoires from the ISB-S CD8 dataset (healthy donor = 16, mild = 108, moderate = 93, severe = 49). d Heatmaps of 3-mer abundances of a random sample of repertoires from the ISB-S CD8 dataset by disease condition (healthy donor = 16, mild = 16, moderate = 16, severe = 16). e Median frequency and pGen scores of COVID-19 and healthy donor associated T cell clusters from GLIPH2 analysis of the ISB-S CD4 dataset, grouped by disease condition. f Detailed view of frequencies and pGen scores of specific clonotypes associated with high frequency T cell clusters from CD4 dataset. Clonotypes are colored by patient disease condition. g Venn diagram showing COVID-19-associated T cell clusters for patients in the ISB-S CD4 dataset grouped by disease condition. 677 TCR specificity clusters were found in common across different severities of COVID-19. h Venn diagram showing overlap between consensus COVID-19-associated T cell clusters (taken from intersection of disease conditions in Fig. 1G) and healthy donors for repertoires in the ISB-S CD4 dataset. Among the 677 T cell clusters commonly found across all levels of COVID-19 severity, 474 clusters were exclusive to COVID-19 patients and not found within healthy donors.

