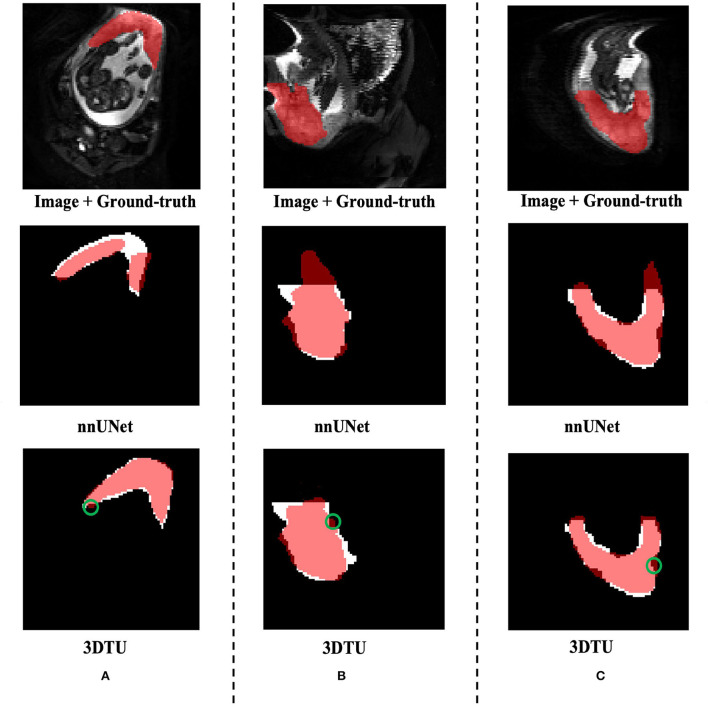
Figure 3.
Visualization of the segmentation results on the Placenta dataset produced by our 3DTU and nnUNet. Columns (A–C) show the x–y plane, y–z plane, and x–z plane of 3D segmentation predictions, respectively. The true-positive regions are highlighted in pink. The false-negative regions are highlighted in (e.g., the green circle regions in the last row). Better view with colors and zooming in.

