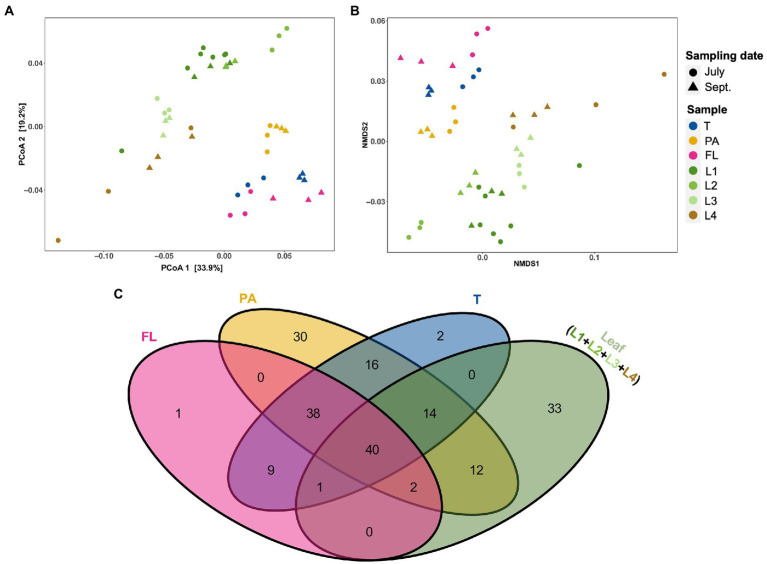
Figure 3.
The relationship among eelgrass phyllosphere (differently aged and decayed leaves) and seawater microenvironment (i.e., T, PA, and FL fractions) microbiota. (A) Principal coordinates analysis (PCoA) and (B) nonmetric multidimensional scaling (NMDS) of microbial communities based on weighted UniFrac distances matrices showing the structural differences of microbial communities among phyllosphere and seawater microenvironments. Samples are colored by sample type (eelgrass surrounding water: T, PA, and FL fractions and leaves: L1–L4), with different shapes for sampling date (July, September). (C) Venn diagrams showing the unique and shared genera among the phyllosphere and surrounding water microenvironment. T, total (PA + FL); PA, particle-associated; FL, free-living; (L1–L3), differently aged leaves; L4, decayed leaves.

