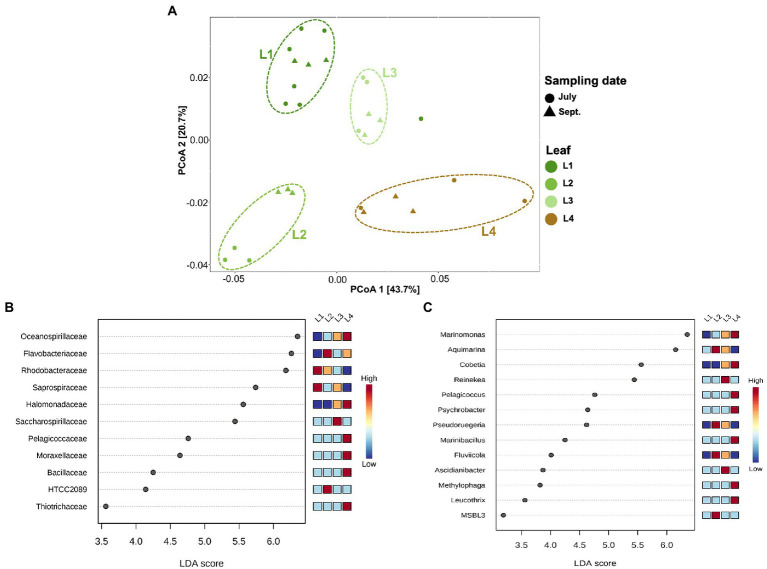
Figure 4.
Principal coordinates analysis (PCoA) and LEfSe analysis among the phyllosphere (A) PCoA of microbial communities of the phyllosphere based on weighted UniFrac distance matrices. Samples are colored by leaf age (L1, L2, L3, etc.), with different shapes for the sampling date (July, September). (B) Linear discriminant analysis (LDA) effect size (LEfSe) analysis at the family level. (C) LEfSe analysis at the genus level. The differences were significant (p < 0.05) among classes (Kruskal–Wallis test). The threshold of the logarithmic LDA score was >3.0. (L1–L3): differently aged leaves; L4: decayed leaves.

