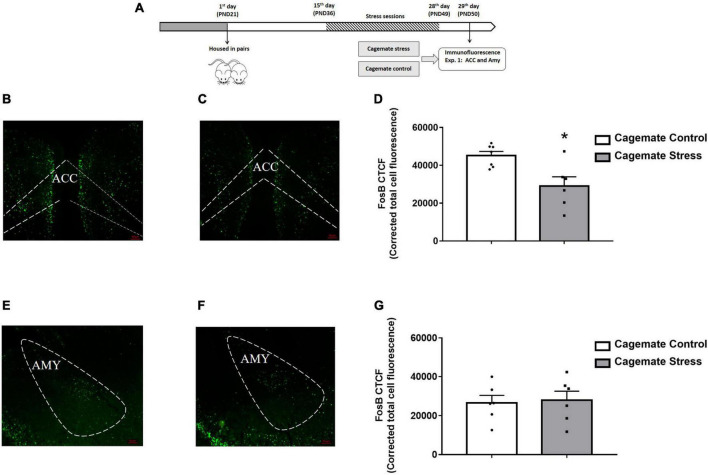
FIGURE 1.
(A) Schematic representation of the experimental protocol (PND, postnatal day). (B,C) Representative photomicrographs of the anterior cingulate cortex (ACC) showing Fos-positive labeled cells in cagemate control and cagemates stress, respectively. (D) Number of Fos-positive labeled cells per corrected total cellular fluorescence of the ACC in cagemates that cohabited in pairs with mice subjected to chronic restraint stress compared to cagemate control. (E,F) Representative photomicrographs of the amygdala showing Fos-positive labeled cells in cagemates control and cagemates stress, respectively. (G) Number of Fos-positive labeled cells per corrected total cellular fluorescence of the amygdala in cagemates that cohabited in pairs with mice subjected to chronic restraint stress compared to cagemate control. All data are presented as mean ± SEM (n = 6–7). *p < 0.05 vs. respective cagemate control group. Student t-test. Amy, amygdala.

