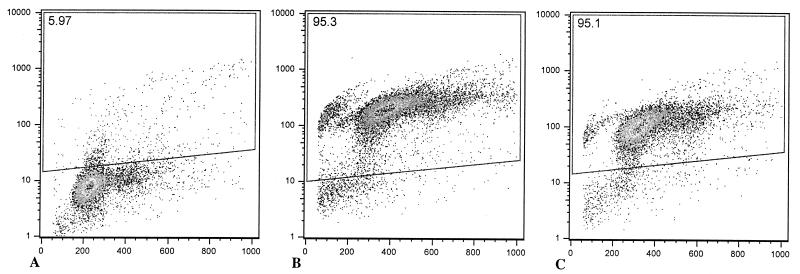
FIG. 6.
Flow cytometric analysis of bovine macrophages infected with wild-type serovar Typhimurium or of sopB mutant grown to the logarithmic phase. Macrophages were infected in Teflon flasks with multiplicity of infection of 50:1, harvested 1 h after infection, processed for TUNEL staining (see Materials and Methods), and analyzed by flow cytometry. In each dot plot, the x axis corresponds to propidium iodide staining and the y axis corresponds to Br-dUTP incorporation. TUNEL-positive cells are within the area indicated by the quadrilateral, and the percentage of these cells is indicated at the left top corner of each panel. These data are from a representative experiment showing uninfected macrophages with a low background of TUNEL-positive cells (A) or macrophages infected with the wild type (B) or sopB mutant (C) containing a high percentage of apoptotic cells.

