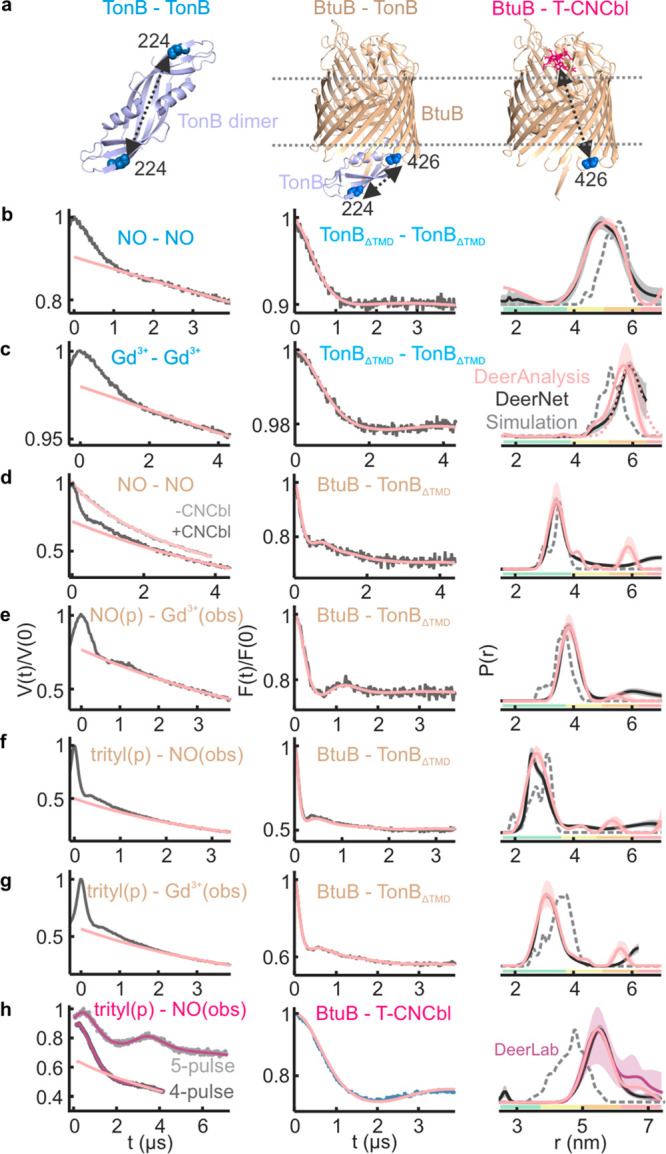
Figure 3.

(a) The interactions observed in the native membrane are highlighted on the corresponding structures. (b–g) PELDOR data for TonBΔTMD dimers or BtuB–TonBΔTMD binding using NO, Gd3+, or OX063 trityl labels as indicated in the native membranes. (b, c) 36 μM TonBΔTMD was added to 18 μM BtuB, (d–g) 20 μM TonBΔTMD was added to 20 μM BtuB, or (h) 20 μM BtuB was mixed with 20 μM (4-pulse PELDOR) or 10 μM (5-pulse PELDOR) T-CNCbl. For P(r), distances obtained from Tikhonov regularization (TR) using DeerAnalysis44 and DEERNet45 are overlaid. The DeerLab46 analysis gave nearly identical outputs (Figure S5). For (c), the form factor corresponding to a single Gaussian fit (5.9 ± 0.4 nm, dotted pink line, see Figure S3) or (h) a two Gaussian fit (5.6 ± 0.4 and 6.8 ± 0.4 nm, pink line), respectively, is shown. In (h), the 4-pulse and 5-pulse PELDOR data were globally analyzed using the DeerLab software package. For the nonidentical spin pairs, the pump (p) and observer (obs) spins are indicated. Corresponding simulations (b and c using PDB 1IHR, d–g using PDB 2GSK, and h using PDB 1NQH) are overlaid (in gray dotted lines).
