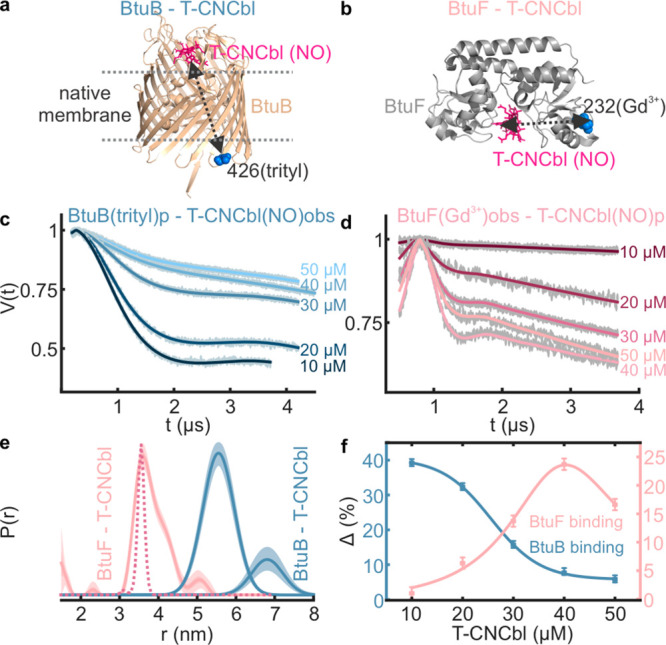
Figure 4.

Selective trityl–NO and Gd3+–NO PELDOR of a mixture containing BtuB(trityl), BtuF(Gd3+), and T-CNCbl(NO) in the native membranes. 20 μM of BtuB and BtuF was mixed with the indicated concentrations of T-CNCbl. (a, b) The observed interactions are highlighted on the corresponding structures. The primary data were globally analyzed using (c) a two Gaussian model (Figure 2h) or TR (d) with the DeerLab program. (e) The obtained distance distributions and the simulation for BtuF–T-CNCbl distances (PDB 1N4A, dotted line) are shown. (f) The Δ values as obtained from (c) and (d) are plotted against T-CNCbl concentration. For BtuB and BtuF, saturation occurs at ≤10 and 40 μM, respectively. Excess T-CNCbl beyond these points further decreases the Δ.
