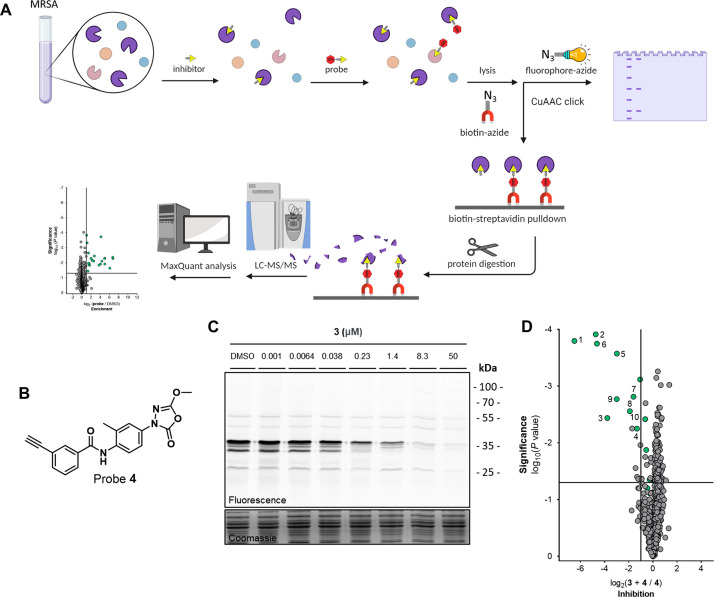
Figure 3.
(A) In situ competitive ABPP workflow on MRSA with using either sodium dodecyl sulfate-polyacrylamide gel electrophoresis (SDS-PAGE) or mass spectrometry read-out. (B) Activity-based probe 4. (C) Gel-based competitive ABPP over a concentration range of 3 versus 1 μM probe 4. (D) MS data inhibition plot comparing the labeled proteome of samples preincubated with inhibitor 3 (10 μM) followed by probe 4 labeling (3 μM) to solely probe-labeled samples. The vertical and horizontal threshold lines represent a log2 change of −1 and a log10(P value) of −1.3 (two-sided two-sample t-test, n = 3 independent experiments per group), respectively. Green dots indicate proteins that are probe targets, as defined in Table S9. BioRender Premium with an academic license was used for (A).

