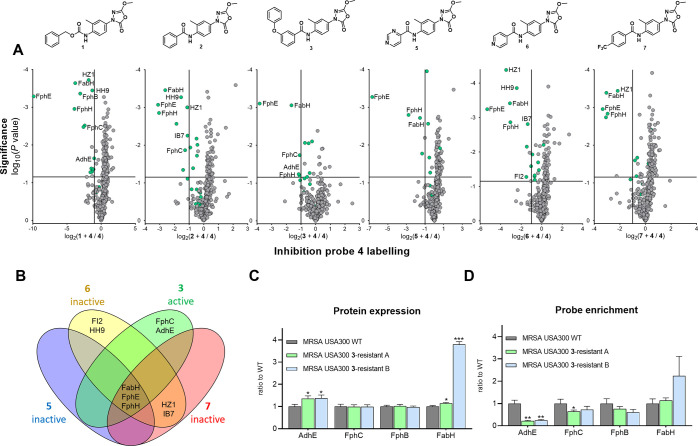
Figure 5.
(A) Individual inhibition plots of active compounds 1, 2, and 3 and inactive compounds 5, 6, and 7. 3 was dosed at 1 μM, while 1, 2, and the inactive analogues were dosed at 10 μM. The vertical and horizontal threshold lines represent a log2 change of −1 and a log10(P value) of −1.3 (two-sided two-sample t-test, n = 3 independent experiments per group), respectively. Green dots indicate proteins that are probe targets, as defined in Table S9. (B) Venn diagram showing the overlap of >50% inhibited proteins between 3 and inactive analogues 5–7. (C) Relative general protein levels in strains resistant to 3 compared to WT. Each group was compared to WT using a two-sided two-sample t-test, n = 3 independent experiments per group. Statistical significance: ***P < 0.001; **P < 0.01; *P < 0.05; n.s. if P > 0.05. (D) Relative protein levels enriched by 4 in strains resistant to 3 (Figure 2B) compared to wild type. Each group was compared to WT using a two-sided two-sample t-test, n = 3 independent experiments per group.

