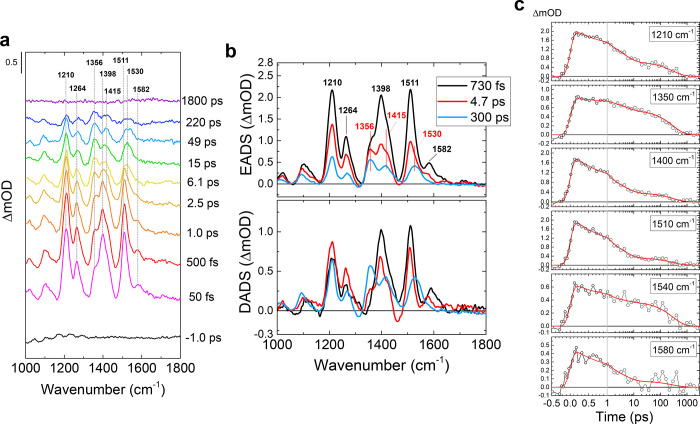
Figure 3.
FSRS spectra of the LA Slr1694-W91F mutant in H2O. (a) Selected transient Raman spectra. (b) Globally fitted EADS (top) and DADS (bottom). (c) Selected time traces with fitting curves. Open dots show the raw data, and red lines show the fitting curves. The time axis is linear up to 1 ps and logarithmic thereafter.

