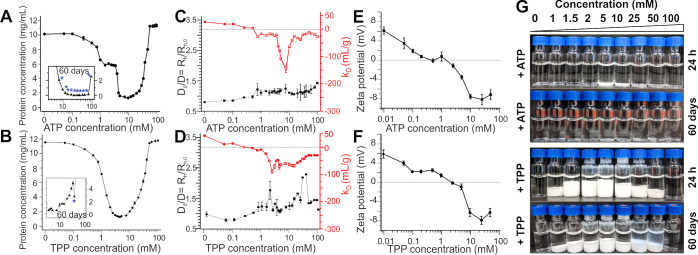
Figure 1.
Biophysical characterization of lysozyme phase transition upon addition of ATP and TPP. (A,B) Protein concentration measurements immediately after sample preparation (black circles) of lysozyme solution upon addition of various concentrations of (A) ATP and (B) TPP. Figure inserts show protein concentration measurements (black triangles) in the ATP/TPP concentration region where crystal formation was observed after 60 days of incubation at room temperature (denoted with blue stars). (C,D) Inverse of the mutual diffusion coefficient normalized by the infinite dilution value D0/D or equivalently Rh/Rh,0 and estimate of the interaction parameter (kD) (red) measured by DLS of the soluble protein fraction after addition of various concentrations of (C) ATP and (D) TPP. (E,F) ζ-Potentials for lysozyme at various concentrations of (E) ATP and (F) TPP. (G) Visual screen of effects of various concentrations of ATP and TPP on lysozyme phase behavior. All samples, except those for ζ-potential measurements, were prepared with 10 mg/mL lysozyme in 10 mM Tris buffer, pH 7.0. Samples for ζ-potential measurements contained 1 mg/mL lysozyme in 10 mM Tris buffer, pH 7.0.

