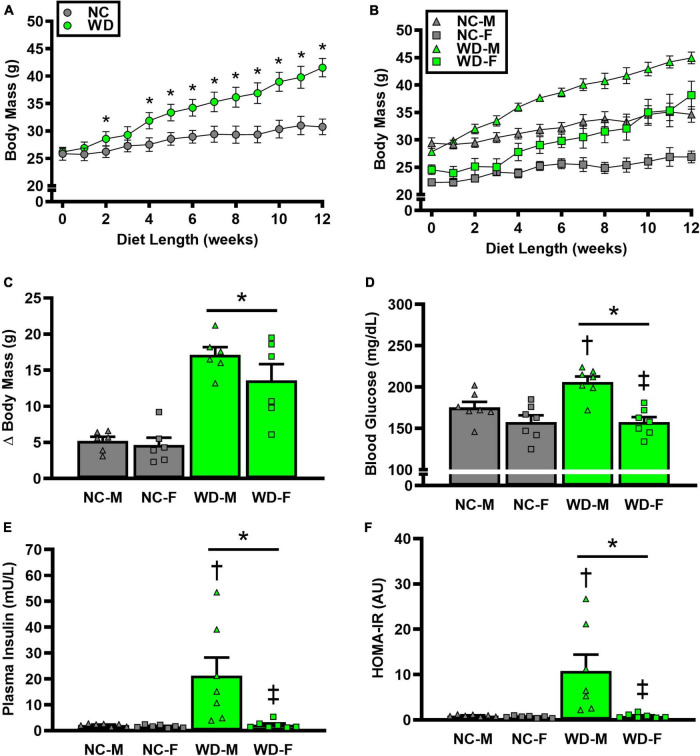
FIGURE 1.
Comparisons in normal chow (NC) and Western (WD) diet-treated male (M) and female (F) mice. Data were analyzed using 2-way and 3-way mixed model ANOVA and 2-way ANOVA. Sidak post-hoc test was used to identify differences in body mass between groups (A) and sexes (B), as well as differences in Δ body mass (C), non-fasting blood glucose (D), non-fasting plasma insulin (E), and HOMA-IR (F) between groups/sexes. *P < 0.05 vs. NC. †P, 0.05 vs. NC within sex. ‡P < 0.05 vs. male within group. Data are individual values and means ± SEM.

