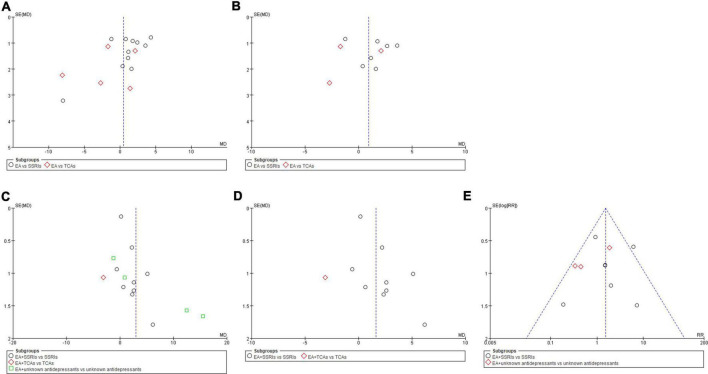
FIGURE 6.
Funnel plots of comparisons. (A) EA vs. antidepressants in severity of depression at the end of treatment. (B) EA vs. antidepressants in severity of depression at week 6 during treatment. (C) EA + antidepressants vs. antidepressants in severity of depression at the end of treatment. (D) EA + antidepressants vs. antidepressants in severity of depression at week 6 during treatment. (E) EA + antidepressants vs. antidepressants in adverse events.

