
Figure 1:
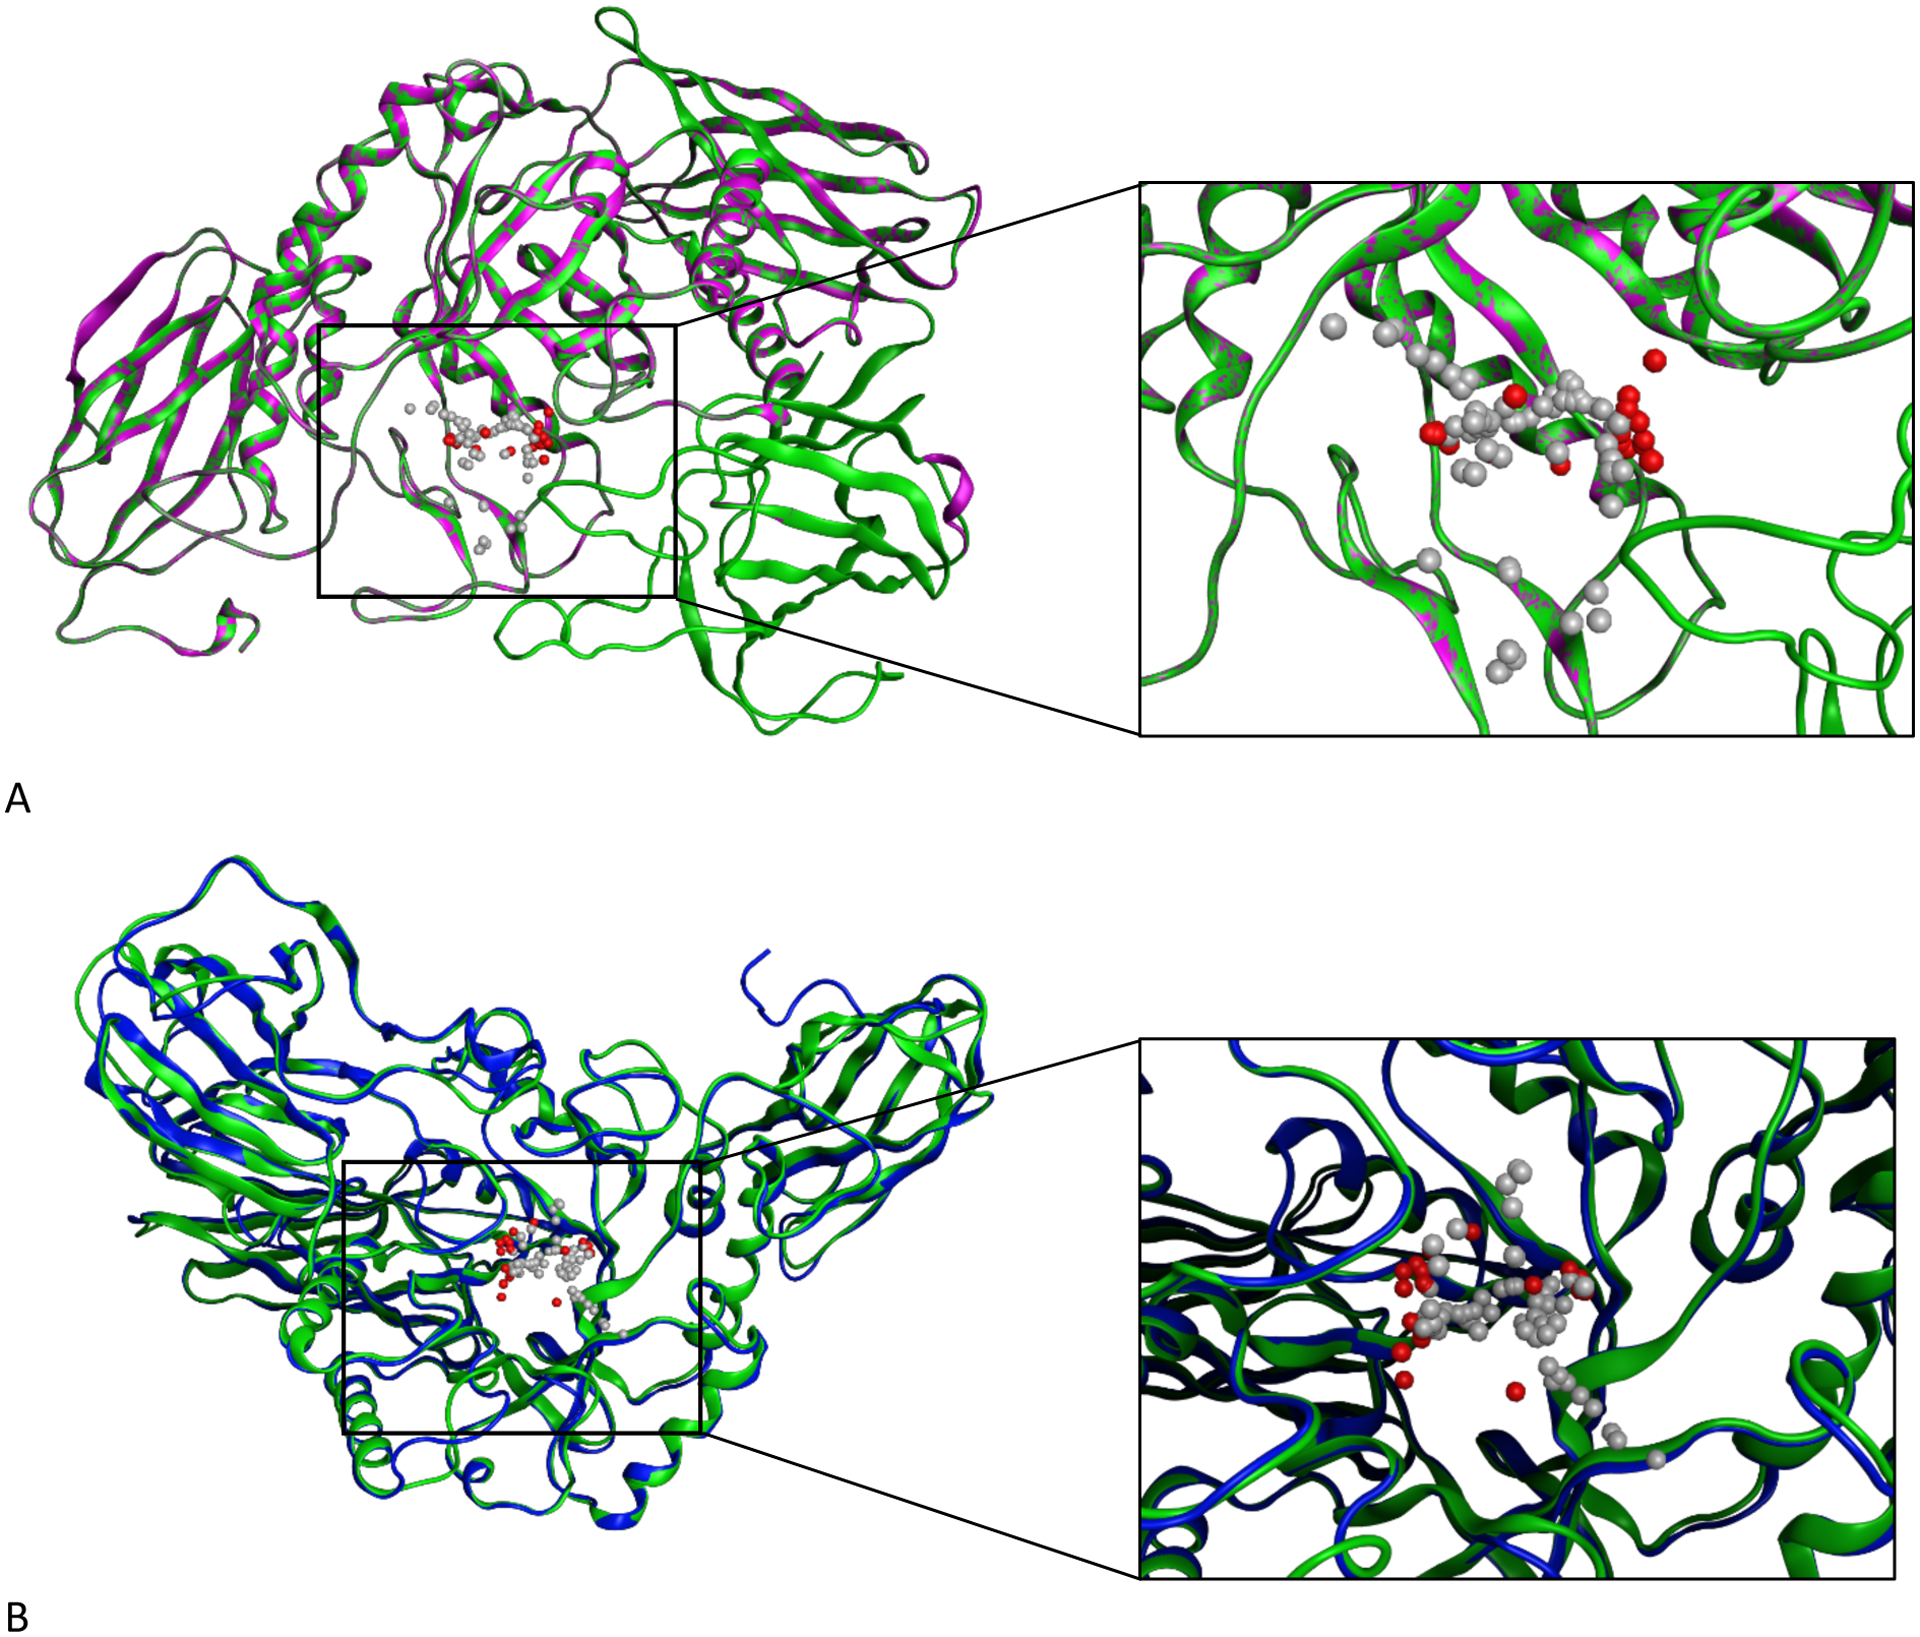
Homology models for ßGUS using both MOE and the I-TASSER server. Panel A shows the single-template homology model we generated in MOE with an enlarged view of the model’s predicted active site (green: MOE model, purple: 6MVH template). Panel B shows the threaded model we obtained from I-TASSER, superimposed on the homology model we generated in MOE and with an enlarged and residue-labeled view of the models’ predicted active sites when occupied by an analog of glucose (blue: I-TASSER model, green: MOE model). The gray and red space-filling spheres are hydrophobic and hydrophilic cavities predicted by the SiteFinder module in MOE.