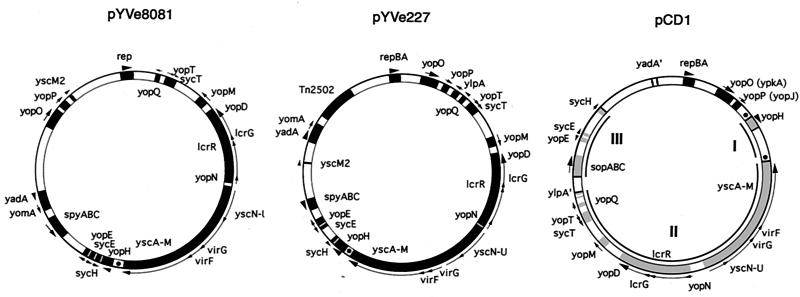
FIG. 2.
Comparison of LCR plasmid maps of pYVe8081, pYVe227, and pCD1. Only representative genes are shown, to facilitate orientation. The maps of pYVe227 (21) and pCD1 (39) are redrawn. Arrows outside the circles indicate the direction of transcription. YadA′ indicates the yadA pseudogene in pCD1, and Tn2502 is the arsenic resistance transposon in pYVe227. Regions in pCD1 involved in the inversions referred to in the text are shown in gray and numbered. The dots represent GTATT direct repeats in pYVe8081, pYVe227, and pCD1.

