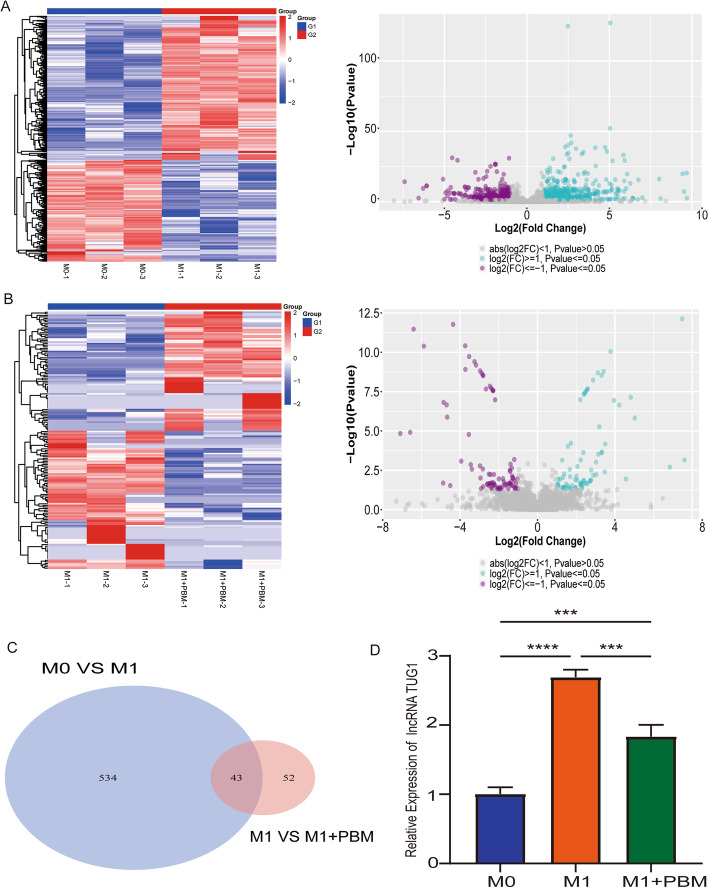
Fig. 2.
lncRNA TUG1 as a potential target of PBM. A Differentially expressed lncRNAs in M0 group versus M1 group were presented as heat map and volcano map. B Differentially expressed lncRNAs in M1 group versus M1 + PBM group were presented as heat map and volcano map. C Using Venn diagram to present the difference lncRNAs co-expressed between the two groups (M0 versus M1, M1 versus M1 + PBM). D RT-PCR was used to detect the expression of lncRNA TUG1. n = 3 per group. ***P < 0. 001, ****P < 0.0001

