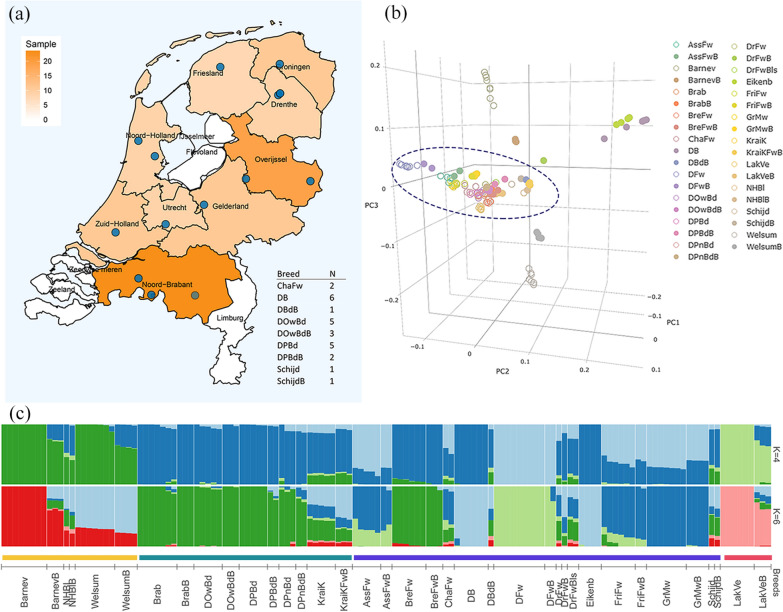
Fig. 1.
Population structure in Dutch chicken breeds. a The map shows the provinces in the Netherlands from where the breeds originated. The blue circles on the map represent the known region of origin of the samples, whereas those breeds without any clear geographic information are listed in table format at the bottom-right. b Principal component analysis showing the first three principal components. c Admixture analysis with K = 4 and 6. The ancestry coefficients of each individual are shown by vertical bars. The horizontal bars display the different clusters, CL1 (yellow), CL 2 (green), CL3 (purple), and CL4 (Lakenvelder and its bantam) (red). Abbreviated breed names are in Additional file 1: Table S1

