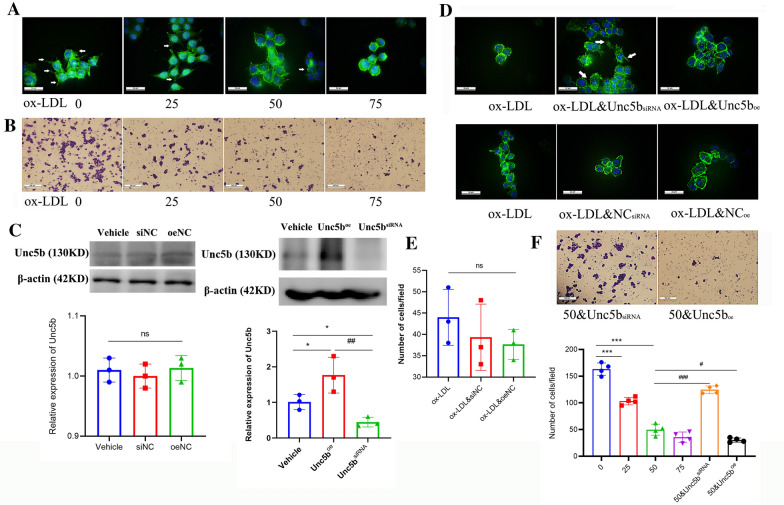
Fig. 2.
Unc5b suppresses migration of macrophage foam cells Raw 264.7 cells were subjected to various concentrations of ox-LDL (0, 24, 50 and 75 μg/ml) for 24 h, F-actin was stained with phalloidin-iFluor 488 (green), and the nuclei were counterstained with DAPI (blue), pseudopodia of macrophages were marked in white arrows (A), the number of cells on the dark side was identified by Transwell assay (B). (C) Western blot analysis of Unc5b protein levels in Raw 264.7 cells with Unc5boe or Unc5bsiRNA. Quantification of Unc5b expression from Western blotting. Data are reported as the mean ± S.D. (n>3, * p< 0.05vs vehicle group, ##p< 0.01 vs Unc5boe group, t-test). (D) Raw 264.7 macrophages were pretreated with Unc5bsiRNA or pcDNA3.1-Unc5b plasmid combined with ox-LDL for another 24 h, cells were stained by F-actin (green), DAPI (blue), and pseudopodia (marked in white). (E, F) Raw 264.7 cells were pretreated with empty plasmid or Unc5bsiRNA or Unc5boe, the number of cells on the dark side was identified by Transwell assay upon ox-LDL (50 μg/ml) treatment. Data are reported as the mean ± S.D. (bar=100 μm, n=4, ***, p< 0.001 vs ox-LDL 0 μg/mL group,###, p< 0.001 vs ox-LDL 50 μg/mL, t-test)

