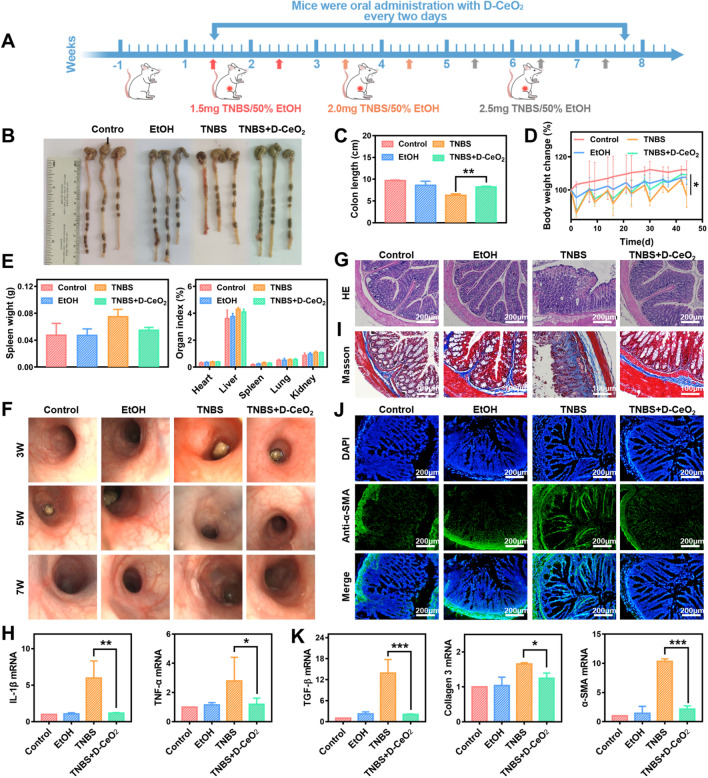
Fig. 7.
The anti-inflammatory and anti-fibrotic effects of D-CeO2 in TNBS-induced colitis. A The scheme of animal experiments (Red arrows: 1.5 mg TNBS/50% EtOH enema dose; Orange arrows: 2.0 mg TNBS/50% EtOH enema dose; Grey arrows: 2.5 mg TNBS/50% EtOH enema dose). B Representative images of the colon with or without D-CeO2 treatment and C corresponding colon length. D Body weight change. E Spleen weight and organ index. F The endoscopic, G H&E staining and H IL-1β, TNF-α mRNA levels were used to assess the levels of inflammation. I Masson staining showing the collagen deposition in colonic tissue. J Immunofluorescence of colonic tissue with α-SMA. K TGF-β, Collagen 3, and α-SMA mRNA levels were illustrated by qRT-PCR analysis. One-way of ANOVA were performed for statistical comparison, *p < 0.05, **p < 0.01, ***p < 0.001

