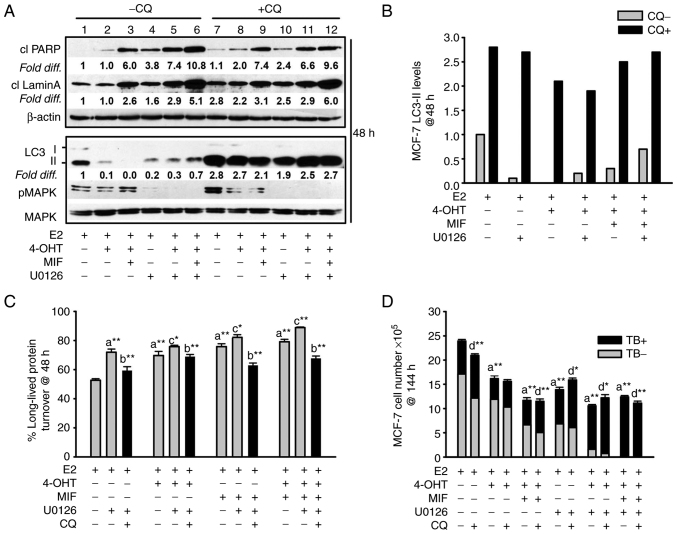
Figure 4.
Apoptosis and non-cytotoxic autophagy detected in antiestrogen sensitive breast cancer cell populations undergoing MEK1/MAPK1/2 blockade. (A, top panel) Increased levels of the cleaved forms of lamin A and PARP, two markers of apoptosis, were consistently detected by 48 h of hormonal treatments conducted in the presence of U0126 (top panel; signal intensities in lanes 4-6 were compared with lanes 1-3, with signal intensity for E2-treated control cells in lane 1 arbitrarily set to a value of 1 after corrections were calculated per lane using β actin as the loading control. (A, bottom panel) Increased steady-state LC3-II levels in cells undergoing the designated treatments for 48 h in the presence of CQ compared with the respective treatment conducted in the absence of CQ (signal intensity in lanes 7-12 was compared with lanes 1-6). Corrections for loading per lane were made using total MAPK as the loading control, also allowing the efficacy U0126-mediated blockade of MEK1/MAPK1/2 to be evaluated. (B) Graphical representation of the relative fold difference in the cells undergoing treatments in the presence vs. absence of CQ, shows higher steady-state LC3-II levels in the cells undergoing treatments in the presence of CQ, indicative of active autolysosomal flux under conditions of MEK1/MAPK1/2 blockade. (C) Long-lived protein catabolism (autophagic flux) was functional in hormonally-treated breast cancer cells in the absence and presence of MEK1/MAPK1/2 blockade by U0126 treatment, with catabolism in 4-OHT and/or MIF-treated cell populations showing increased catabolism relative to E2-treated control cells. CQ was added to duplicate cell populations to confirm the involvement of the lysosome in the long-lived protein turnover measured. (D) CQ-mediated blockade of autolysosomal flux did not increase the number of viable (trypan blue negative, designated TB-) cells, and modestly increased the number of non-viable cells (designated TB+) in cell populations undergoing hormonal treatments in the absence and presence of U0126. Results are expressed as the mean ± SD values. Comparisons that were statistically significant include: athe designated treatment compared with E2-treated control cells; bthe designated treatment conducted in the presence of CQ relative to the respective treatment conducted in the absence of CQ; cthe designated treatment conducted in the presence of U0126 relative to the respective treatment conducted in the absence of U0126; dCQ mediated inhibition of cell number or increases in trypan blue positive cells (TB+). *P<0.05 and **P<0.001. CQ, chloroquine; 4-OHT, 4-hydroxytamoxifen; TB+, trypan blue; MIF, mifepristone.

