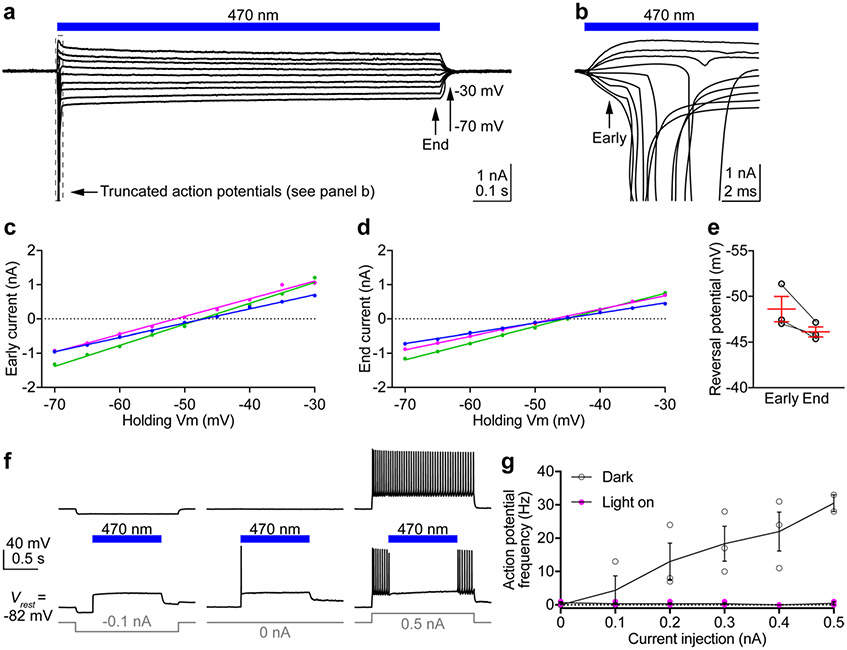
Extended Data Fig. 9 ∣. Photoactivation of HcKCR2 in neurons causes action potentials, but can also inhibit neuronal spiking.
a, Photocurrent traces of a HcKCR2-expressing neuron in response to a 1-s 470 nm light pulse (18.0 mW mm-2) at holding voltages increased in 5-mV steps. HcKCR2 generated robust photocurrents, but at more negative voltages the onset of illumination caused large inward currents, corresponding to action potentials (boxed segment, see its expansion in b). b, Expanded photocurrent traces of the boxed segment in a. c, d, IV curves of the early photocurrent before the onset of action potentials (c) and the current at the end of illumination (d) of individual neurons indicated by different colors (P < 0.0001, R2 > 0.99 for all linear regressions). e, Reversal potentials calculated from the data in c and d (P = 0.1, two-tailed paired t test). The reversal potentials of HcKCR2 are higher than those of HcKCR1, consistent with the results in HEK293 cells (Extended Data Fig.2). f, Membrane voltage traces of a HcKCR2-expressing neuron in response to −0.1 (left), 0 (middle), or 0.5 nA (right) current injections without (top) and with (bottom) 470 nm illumination. When the membrane potential was at rest or depolarized (middle and right), photoactivation of HcKCR2 often caused action potentials at the onset of light because the reversal potential was close to the action potential threshold. Nevertheless, action potentials evoked by current injections were suppressed by long pulses of light (right) due to shunting inhibition. g, The frequencies of action potentials evoked by different current injections with (magenta) and without (black) photoactivation (P > 0.99 for all current levels by the Multiple Wilcoxon matched-pairs signed rank test with Bonferroni–Dunn multiple corrections). Data in e and g are expressed as mean ± sem, n = 3 neurons from 1 male and 1 female mouse at the age of 3–4 weeks.

