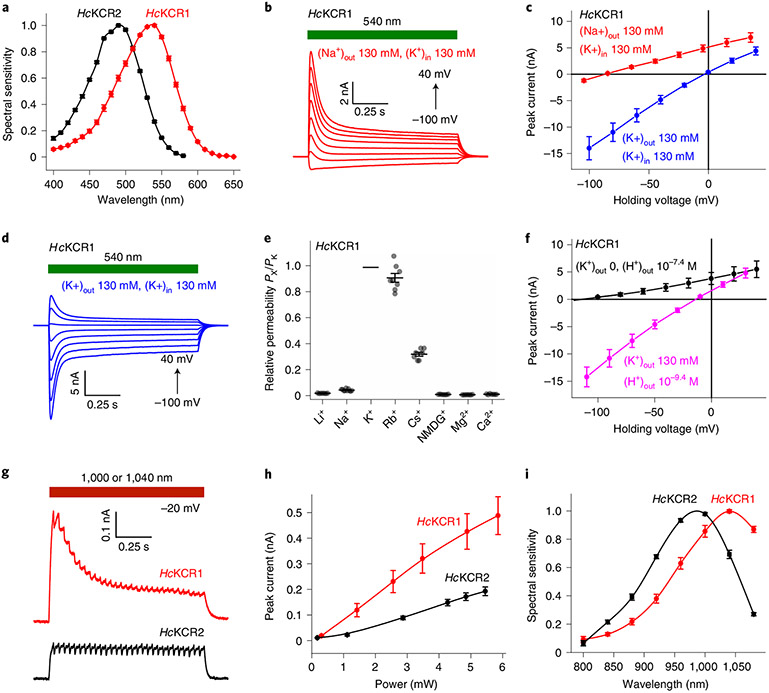
Fig. 2 ∣. KCR photocurrents evoked by continuous light and 2P excitation.
a, Action spectra of photocurrents in the visible range (mean ± s.e.m., n = 6 and n = 10 cells for HcKCR1 and HcKCR2, respectively) constructed from measurements of their initial slopes (Methods). b, Photocurrent traces recorded from HcKCR1 in response to 1-s light pulses (540 nm, 6.3 mW mm−2) upon 20-mV voltage increments in the Na+ bath. d, Photocurrent traces recorded from HcKCR1 as in b but in the K+ bath. c, IV curves (mean ± s.e.m., n = 7 cells from three independent experiments) in the Na+ (red) and K+ (blue), pH 7.4. f, IV curves (mean ± s.e.m., n = 7 cells from three independent experiments) in the NMDG+ bath, pH 7.4 (black) and K+ bath, pH 9.4 (magenta). e, Relative permeabilities (PX/PK); lines, mean ± s.e.m. (n = 7 cells from three independent experiments for Li+, Cs+, NMDG+, Mg2+ and Ca2+, n = 8 cells for Rb+ and n = 10 cells for Na+, each from four independent experiments); symbols, data from individual cells. g, Photocurrent traces recorded upon 2P excitation (HcKCR1, 1,040 nm, 3.8 mW; HcKCR2, 1,000 nm, 3.5 mW). h, Dependence of 2P photocurrents on the laser power (mean ± s.e.m., n = 7 and n = 8 cells for HcKCR1 and HcKCR2, respectively; each from three independent experiments). i, Action spectra of photocurrents under 2P excitation (mean ± s.e.m., n = 6 and n = 10 cells, each from three independent experiments, for HcKCR1 and HcKCR2, respectively). Source data are provided.

