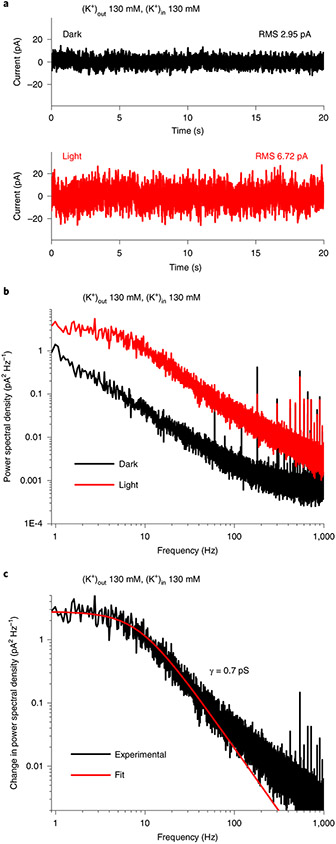
Fig. 3 ∣. Determination of HcKCR1 unitary conductance.
a, Current noise in the dark (black) and under 540 nm, 60 μW mm−2 illumination (red) recorded from a HcKCR1-transfected HEK293 cell. RMS, root mean square. b, Power spectra of the noise in the dark (black) and under illumination (red). c, Difference (light minus dark) power spectrum (black) and its Lorenzian fit (red). γ, unitary conductance. For more detail, see Methods.

