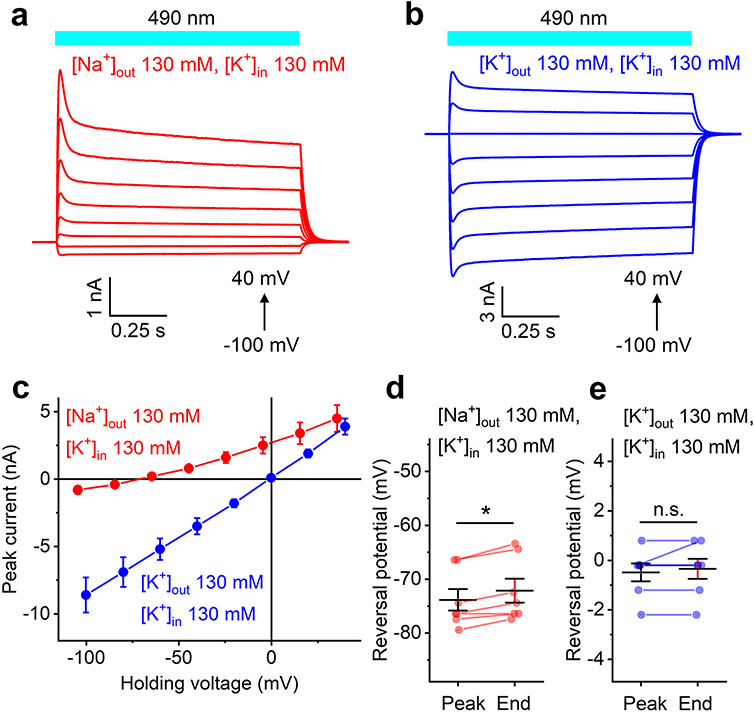
Extended Data Fig. 2 ∣. Electrophysiological characterization of HcKCR2 in HEK293 cells.
a, b, Series of HcKCR2 photocurrents recorded in response to 1-s light pulses under indicated ionic and voltage conditions. c, The IV curves measured under indicated ionic conditions (mean ± sem, n = 7 cells from 3 independent experiments). d, e, The Vrev values determined for the peak current and current at the end of a 1-s light pulse under indicated ionic conditions. The symbols are data from individual cells, the lines are the mean ± sem, n = 7 cells from 3 independent experiments. *, P = 0.031; n. s. (not significant), P = 1 by two-sided paired sample Wilcoxon signed ranks test. Source data are provided.

