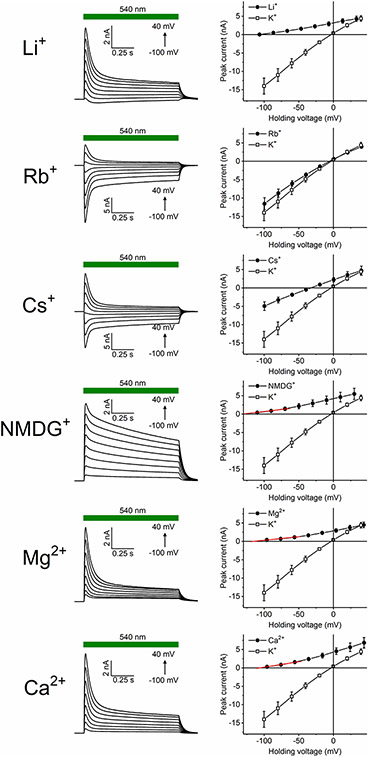
Extended Data Fig. 3 ∣. Analysis of relative permeabilities of HcKCR1 for metal cations and NMDG+.
Left, HcKCR1 peak photocurrents recorded in response to 1-s light pulses with 130 mM KCl in the pipette and 130 mM of the indicated cation in the bath. Right, the corresponding IV curves (mean ± sem, n = 8 cells from 3 independent experiments). The red lines show linear approximations used to determine the Vrev. Source data are provided.

